What is Bollinger Fibo Bands Indicator?
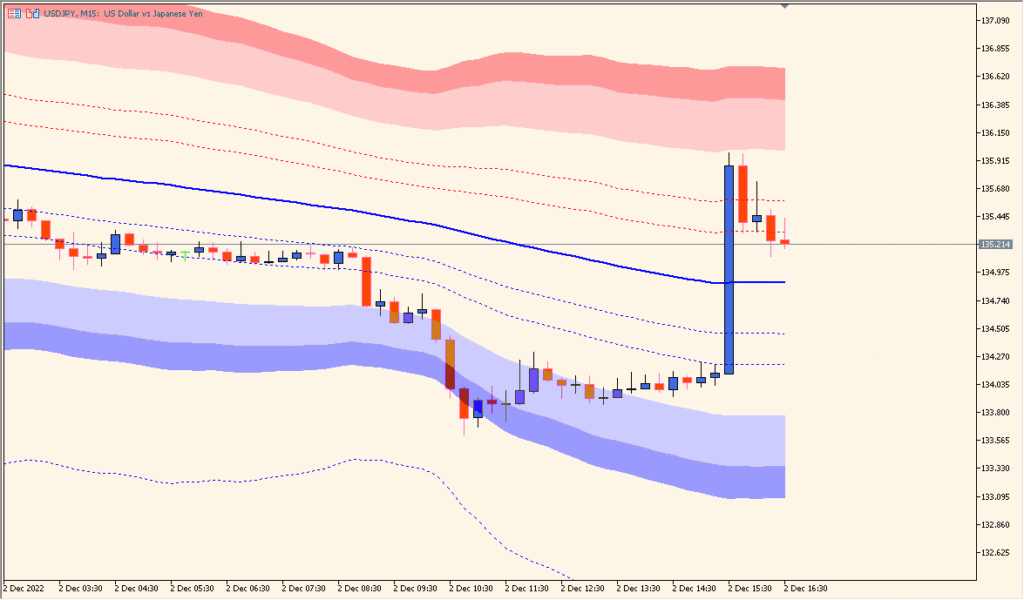
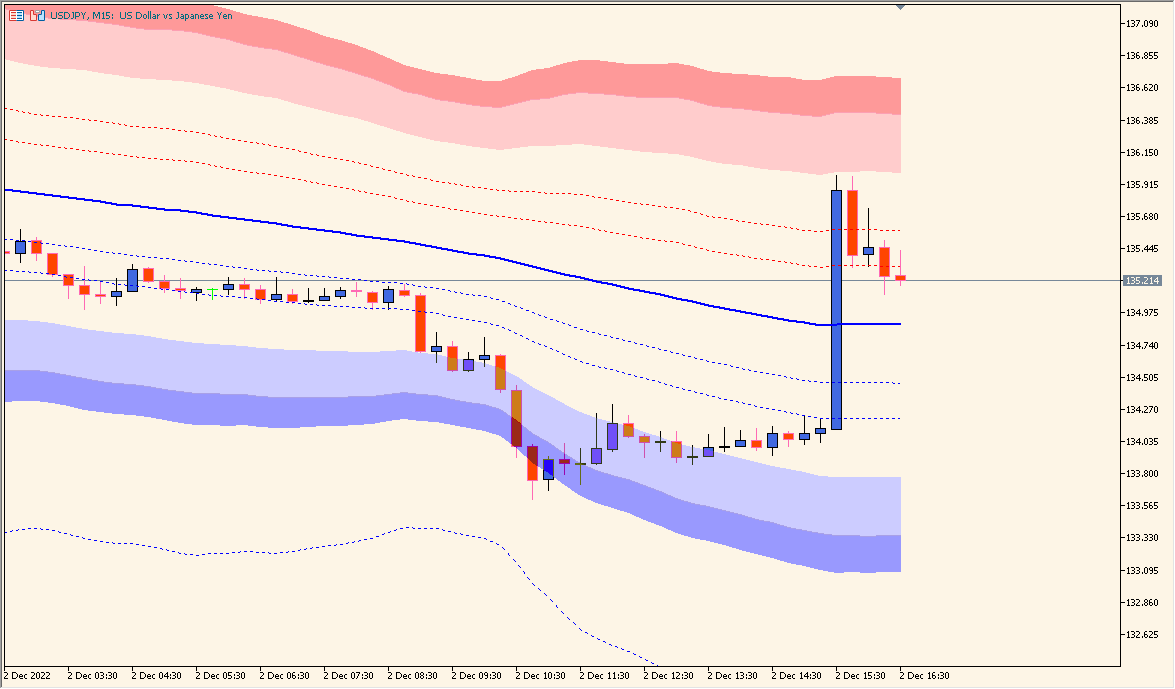
The Bollinger Fibo Bands indicator for MT4 expands the classic Bollinger Bands concept by adding Fibonacci-based levels to visualize volatility and potential price zones more clearly. It helps traders identify not only overbought or oversold conditions but also key retracement and extension areas where price reactions are likely to occur.
By combining standard deviation calculations with Fibonacci multipliers, the indicator draws multiple dynamic bands around a moving average, providing a more detailed structure of market volatility and trend strength.
How to Use It in Practice
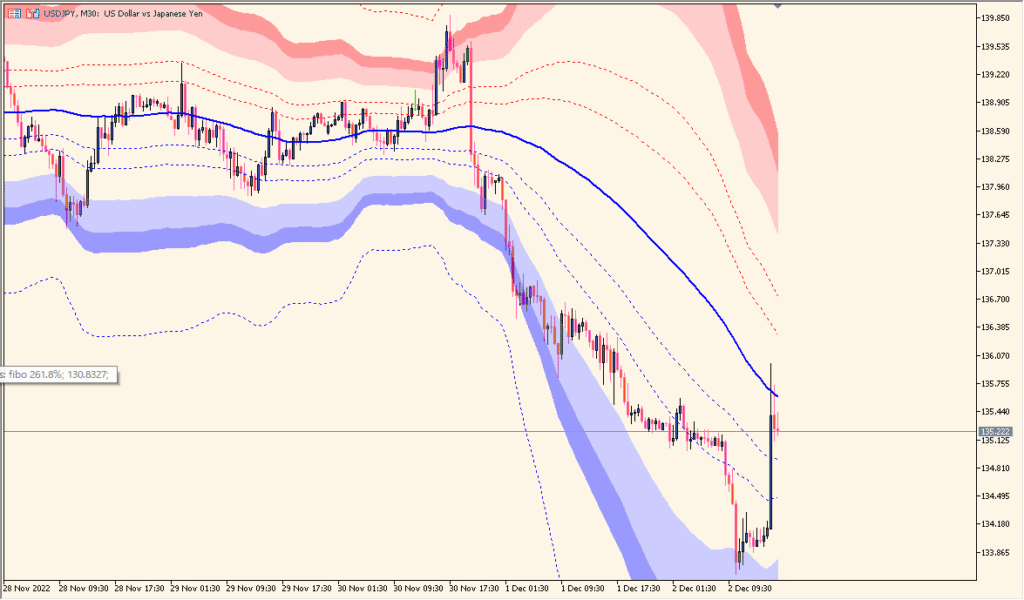
In live trading, the Bollinger Fibo Bands indicator can be used to:
- Identify dynamic support and resistance levels based on volatility and Fibonacci expansion.
- Spot potential breakout areas when price moves outside of the main Bollinger structure.
- Monitor pullbacks during trends using Fibonacci-based inner bands as reaction zones.
- Measure volatility compression before large market moves.
This indicator is particularly effective in trend-following strategies or mean-reversion setups, offering a more refined approach compared to standard Bollinger Bands.
Best Settings & MT5 Parameters for bollinger_fibo_bands
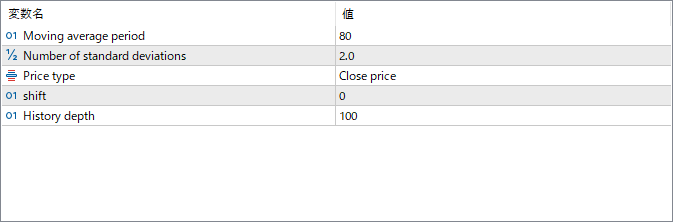
Moving average period
Defines the number of bars used to calculate the central moving average. It determines how smooth or responsive the midline is to price changes.
Number of standard deviations
Sets the distance of the outer Bollinger Bands from the moving average. Higher values widen the bands, showing more volatile conditions.
Price type
Selects which price data to use for calculations (e.g., Close, Open, High, Low). This affects the central moving average and band placement.
shift
Moves the entire indicator forward or backward on the chart by a specified number of bars, useful for visual alignment or analysis.
History depth
Determines how many historical bars are calculated and displayed. Increasing this value shows a longer visual history of the bands.