What is linear-regression-sketcher Indicator?
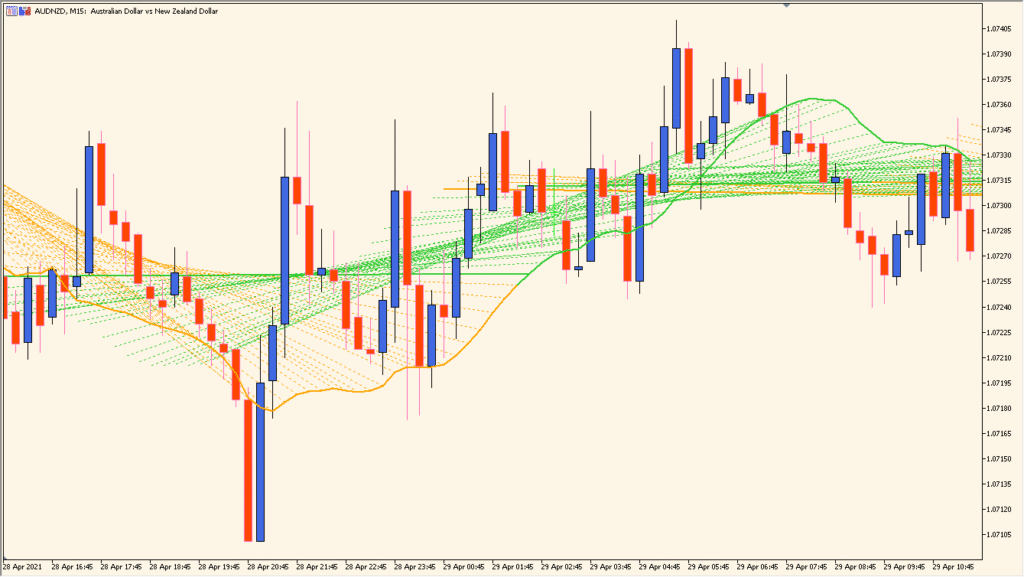
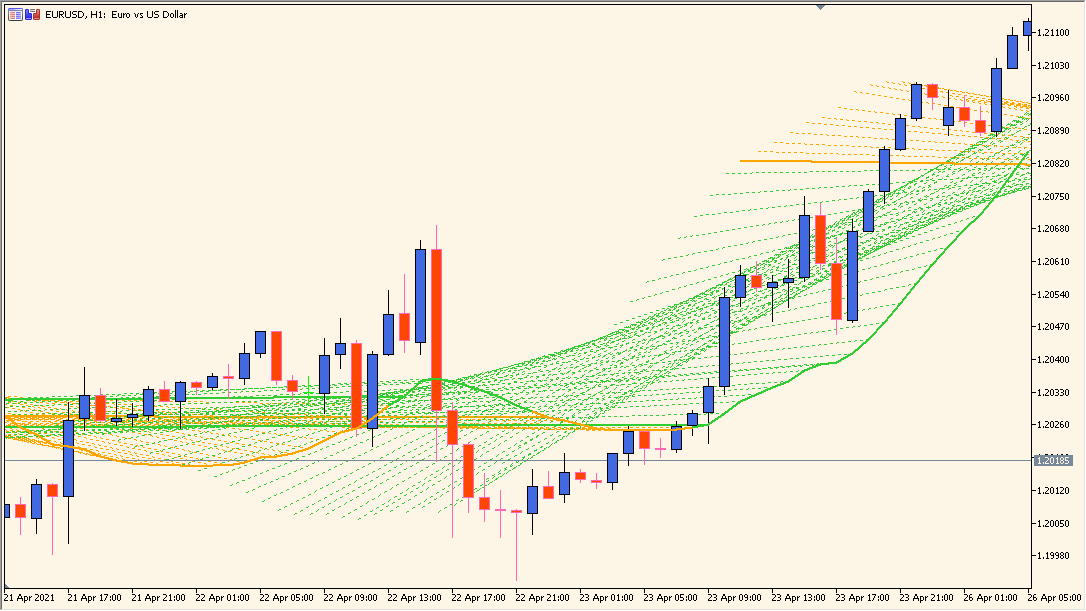
Linear Regression Sketcher is a trend visualization tool that continuously draws linear regression lines over recent price data. Instead of plotting a single regression channel, it sketches multiple regression lines across consecutive bars, creating a layered view of short-term trend direction and strength.
When the lines are tightly aligned and consistently sloping in one direction, the market is trending. When they begin to flatten or overlap in mixed angles, momentum is weakening or shifting.
How to Use It in Practice
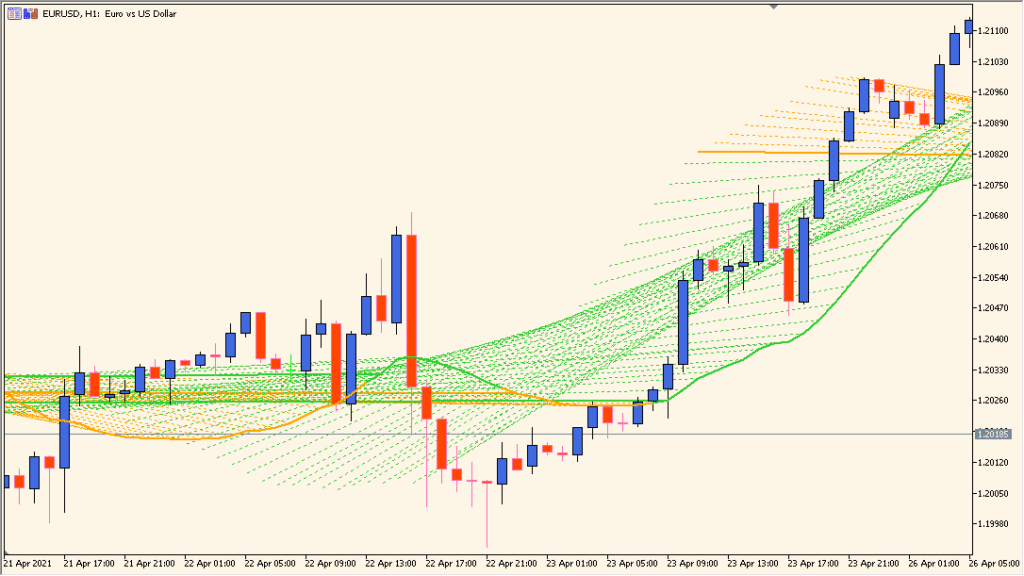
In a strong uptrend, most regression lines slope upward and are colored accordingly. In a strong downtrend, they slope downward and change color. This makes it easy to see directional pressure without relying only on moving averages.
Traders can use it to confirm trend continuation, identify early slope changes before reversals, or evaluate whether a pullback is strong enough to shift the short-term structure. It works well as a visual confirmation tool alongside price action analysis.
Best Settings & MT5 Parameters for linear-regression-sketcher
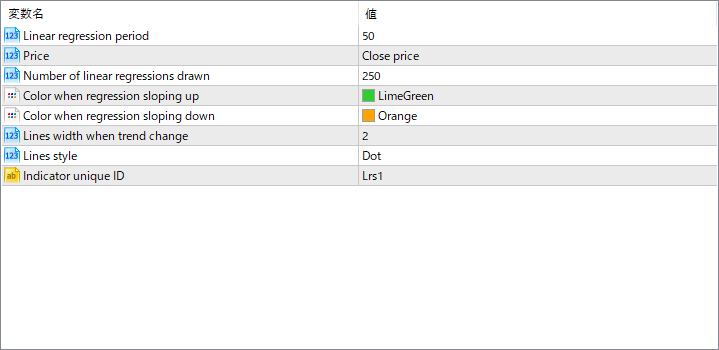
Linear regression period
Defines how many bars are used to calculate each regression line. A shorter period reacts faster to price changes, while a longer period smooths the slope and focuses on broader movement.
Price
Specifies which price type is used for the regression calculation, such as Close, Open, High, or Low.
Number of linear regressions drawn
Sets how many past regression lines are displayed on the chart. A higher number creates a denser visual structure, while a lower number keeps the chart cleaner.
Color when regression sloping up
Determines the color of regression lines when their slope is positive.
Color when regression sloping down
Determines the color of regression lines when their slope is negative.
Lines width when trend change
Controls the thickness of the lines when a slope direction change is detected, helping highlight potential turning points.
Lines style
Defines the visual style of the regression lines, such as solid or dotted.
Indicator unique ID
Provides a unique identifier for the indicator instance. This is mainly used to prevent conflicts when attaching multiple copies of the indicator to the same chart.