What is price-heatmap-v1-05-indicator 1.05 Indicator?
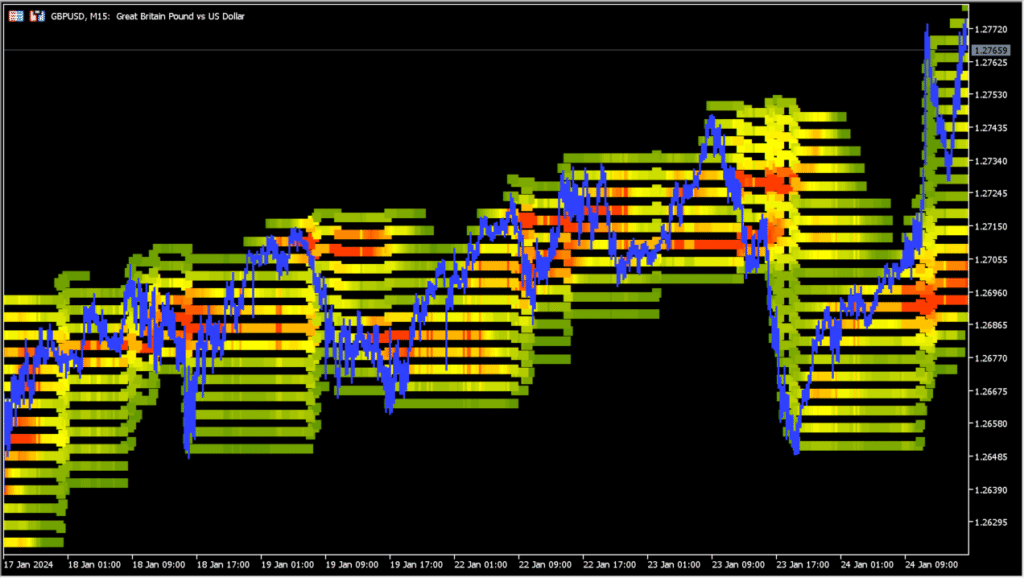
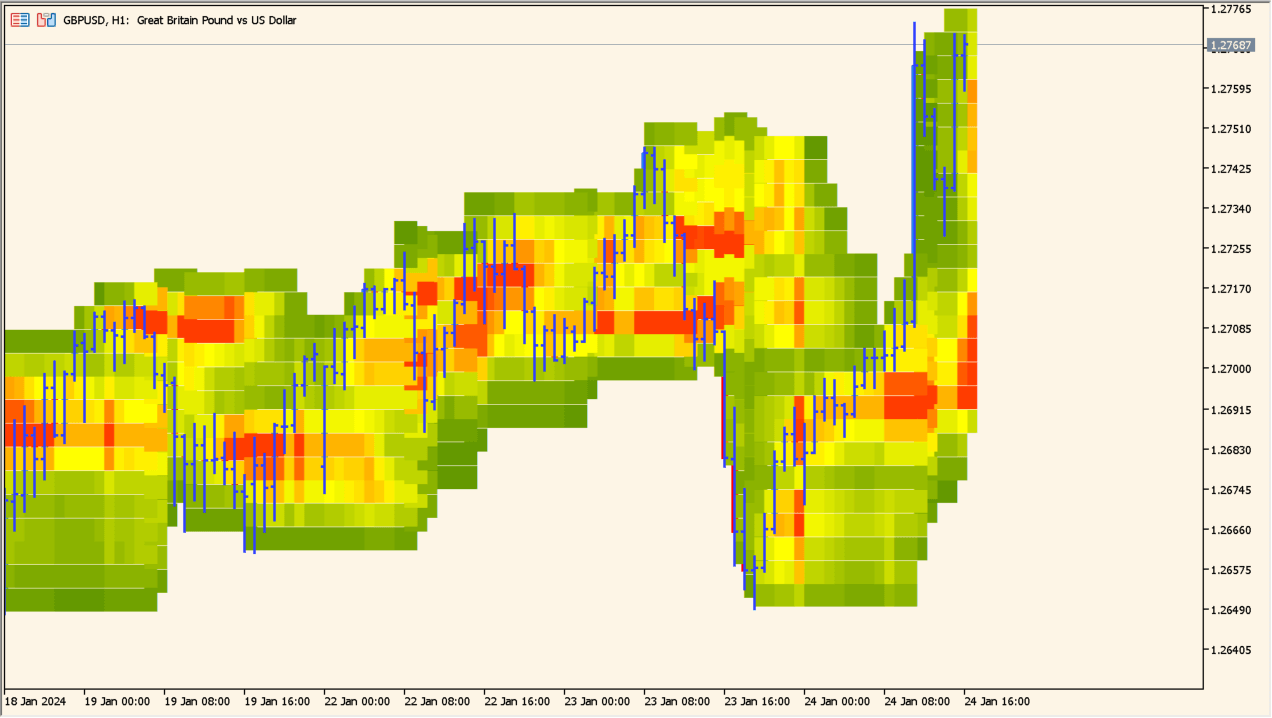
Price Heatmap v1.05 is a market profile–style indicator that visualizes where price activity has concentrated over a selected period. Instead of focusing on indicators derived from formulas, it highlights price levels that have seen repeated trading, making market structure easier to read.
The heatmap is built using histogram bins, where frequently traded price zones stand out visually. This helps traders quickly recognize areas of acceptance, balance, and potential reaction.
How to Use It in Practice
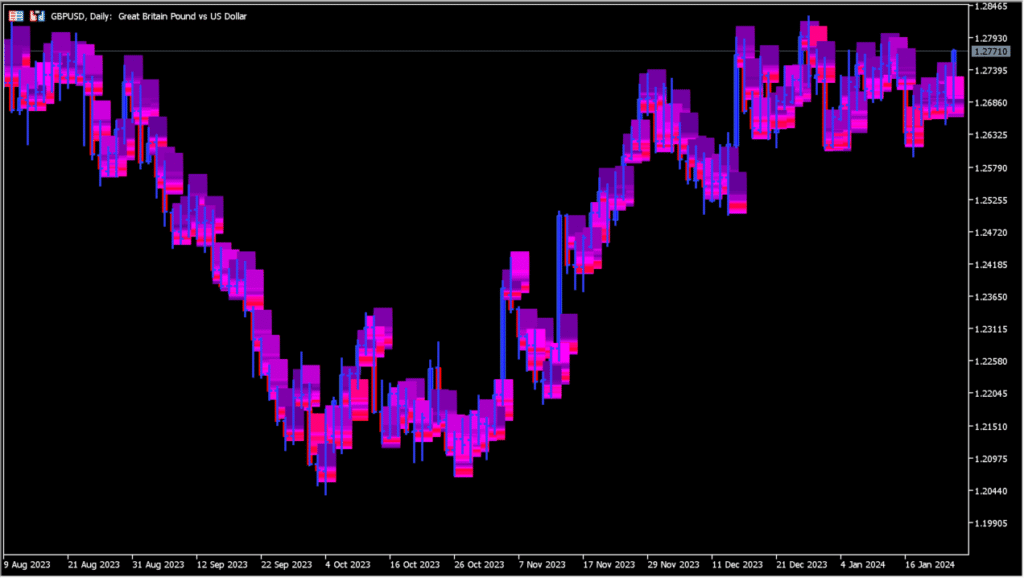
In real trading, this indicator is mainly used for contextual analysis rather than direct signals.
Price levels with strong heat concentration often behave as support or resistance because they represent areas where the market previously accepted value.
When price leaves a dense heat zone and starts trending, the edge of that zone can act as a pullback or decision area.
If heat is evenly spread and no dominant zone is visible, it usually reflects a balanced or ranging market where breakout trades require caution.
Best Settings & MT5 Parameters for price-heatmap-v1-05-indicator 1.05
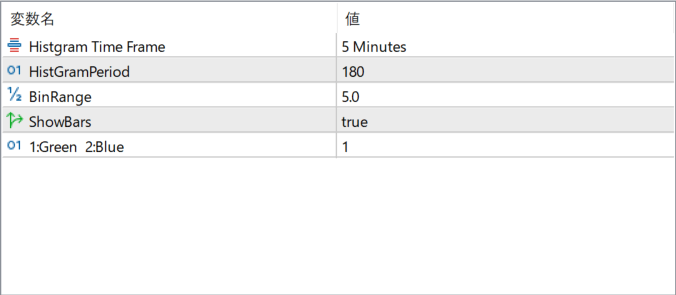
Histogram Time Frame
Sets the timeframe used to build the price histogram. Higher timeframes show broader market structure, while lower timeframes focus on short-term value areas.
HistGramPeriod
Defines how many bars are included in the heatmap calculation. Increasing this value creates a wider historical view, while reducing it emphasizes recent price activity.
BinRange
Controls the price interval used for each histogram bin. Smaller values create finer detail, while larger values simplify the heatmap into broader zones.
ShowBars
Enables or disables the display of histogram bars on the chart, allowing you to focus purely on price if needed.
1:Green 2:Blue
Switches between color display modes for the heatmap, helping adjust contrast and readability depending on chart background.