What is Quantile-Bands Indicator?
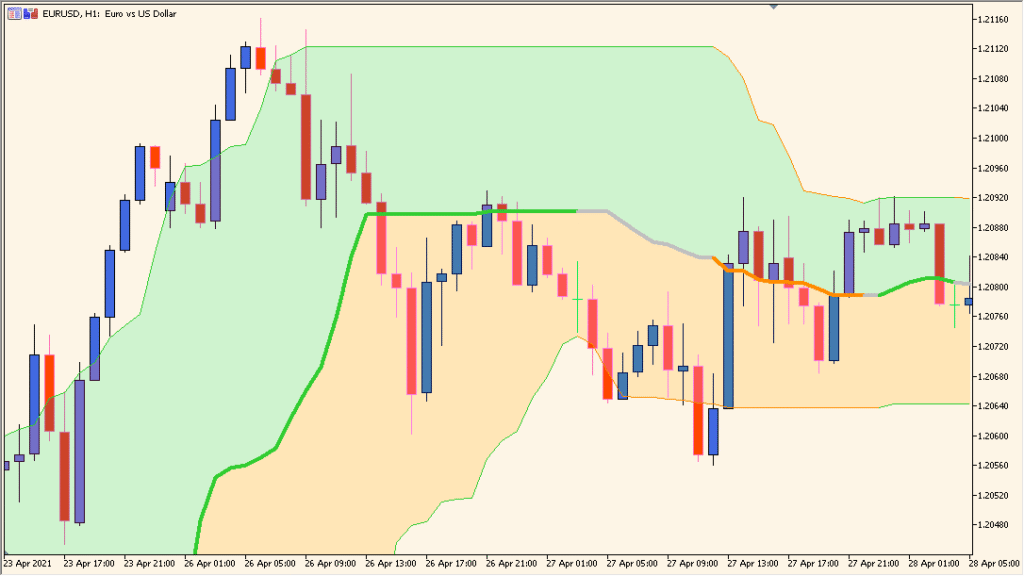
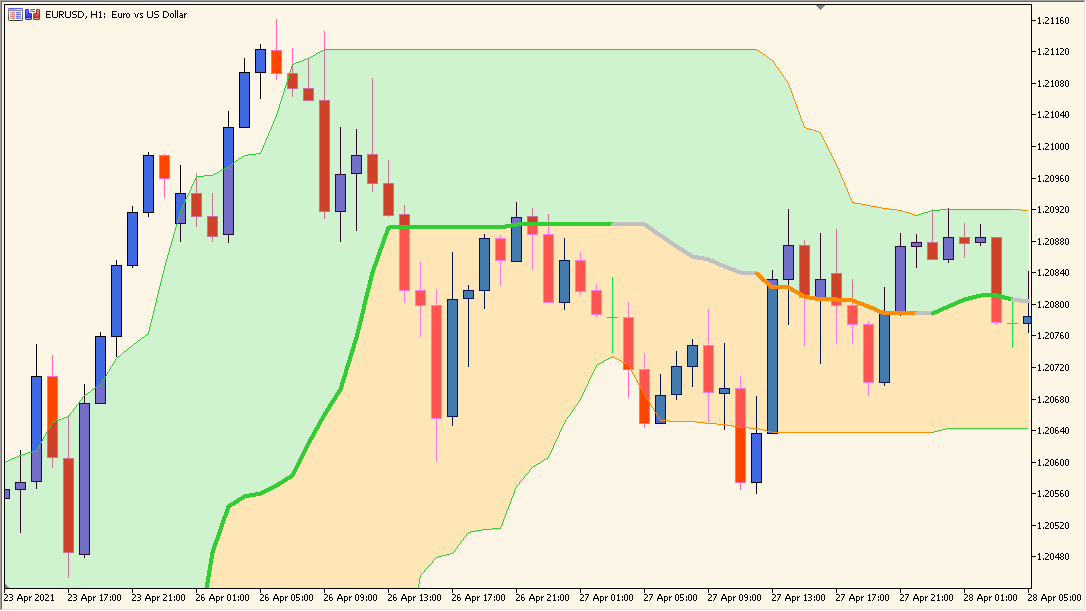
The Quantile-Bands indicator displays dynamic upper, middle, and lower bands based on statistical quantiles of price over a specific period. Instead of using standard deviation like Bollinger Bands, this tool uses quantile thresholds to define potential price zones, making it more robust to outliers and skewed data. It’s ideal for spotting mean-reversion areas, trend containment, or breakout zones.
The bands visually show where price tends to concentrate or deviate. The upper and lower quantile bands act like probabilistic support and resistance zones, while the median band shows the price’s central tendency.
How to Use It in Practice
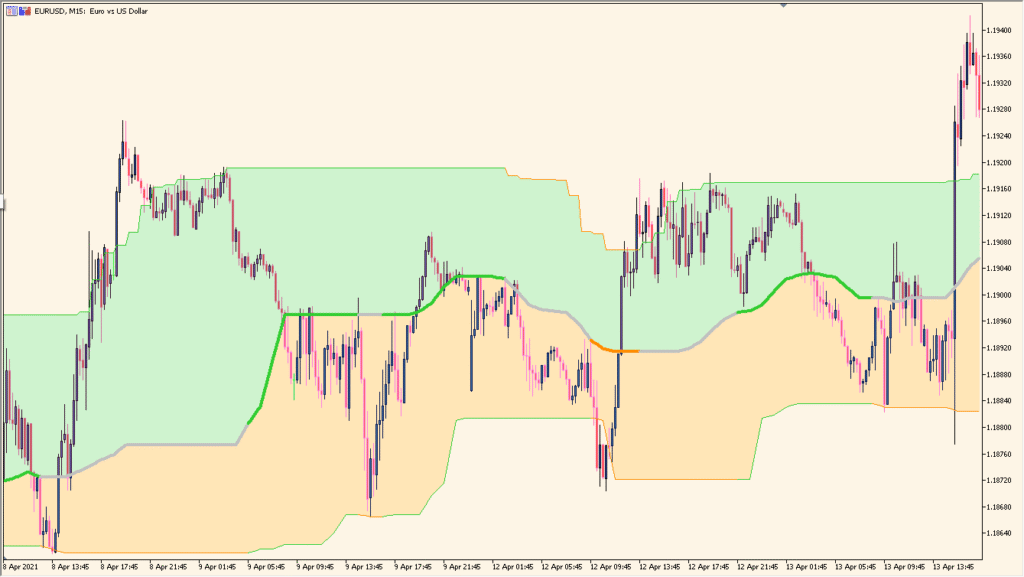
In practical use, Quantile-Bands can help you:
- Identify high-probability reversal zones near the upper or lower bands.
- Use the median band as a dynamic equilibrium level during ranging markets.
- Wait for price to break out of quantile zones to signal a possible trend expansion.
- Adjust your strategy based on market type: ranging (fade the extremes) or trending (ride the breakouts).
Combining it with volume, momentum, or S&R indicators can improve trade timing and reduce false signals.
Best Settings & MT5 Parameters for quantile-bands
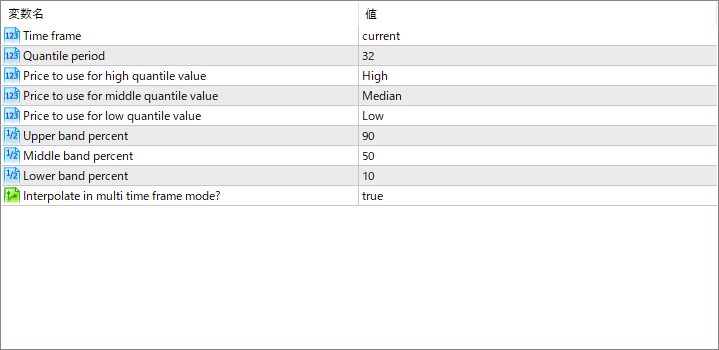
Time frame
Specifies which chart timeframe the indicator should use. You can analyze quantiles based on a higher or current timeframe.
Quantile period
Sets the number of candles used to calculate quantile bands. A larger period smooths out the bands and gives a broader view of price distribution.
Price to use for high quantile value
Defines which price (e.g., High, Close) is used when computing the upper quantile threshold.
Price to use for middle quantile bands
Specifies which price is used to calculate the median quantile, often set to Median or Close.
Price to use for low quantile value
Chooses the price input for calculating the lower quantile boundary.
Upper band percent
Defines the quantile level for the upper band (e.g., 90% means price rarely exceeds this level).
Middle band percent
Sets the quantile level used for the central band, typically the 50% median.
Lower band percent
Defines the quantile for the lower band, such as 10% (price usually stays above this level).
Interpolate in multi time frame mode?
When enabled, smooths the quantile lines when using a higher timeframe than the current chart for better visual alignment.