What is Regression Channel 2.0 Indicator?
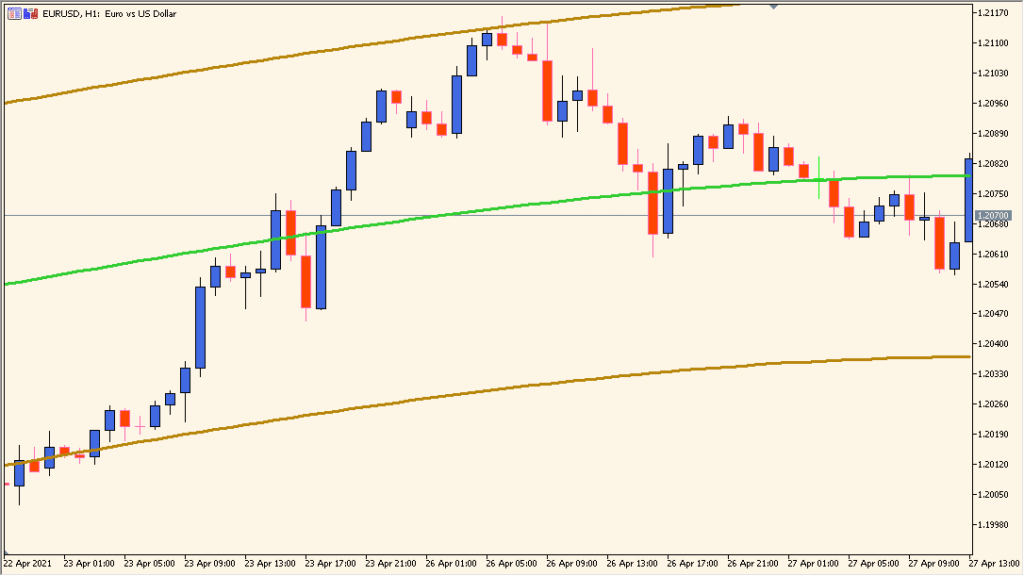
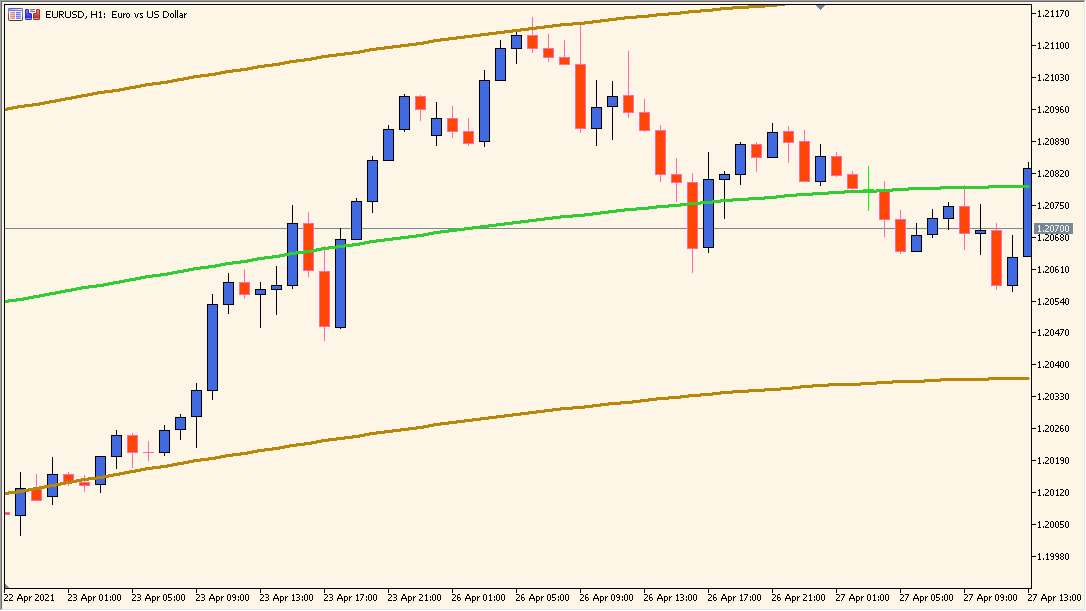
This indicator plots a regression channel based on polynomial regression. It calculates a central regression line and generates upper and lower bands using standard deviation. The result is a structured price channel that adapts to recent price behavior and helps you understand trend direction and volatility in a simple visual form.
The regression line reflects the general path of price, while the outer bands show how far price typically deviates from that trend. This makes the indicator useful for spotting extremes, trend strength, and potential reversal areas.
How to Use It in Practice
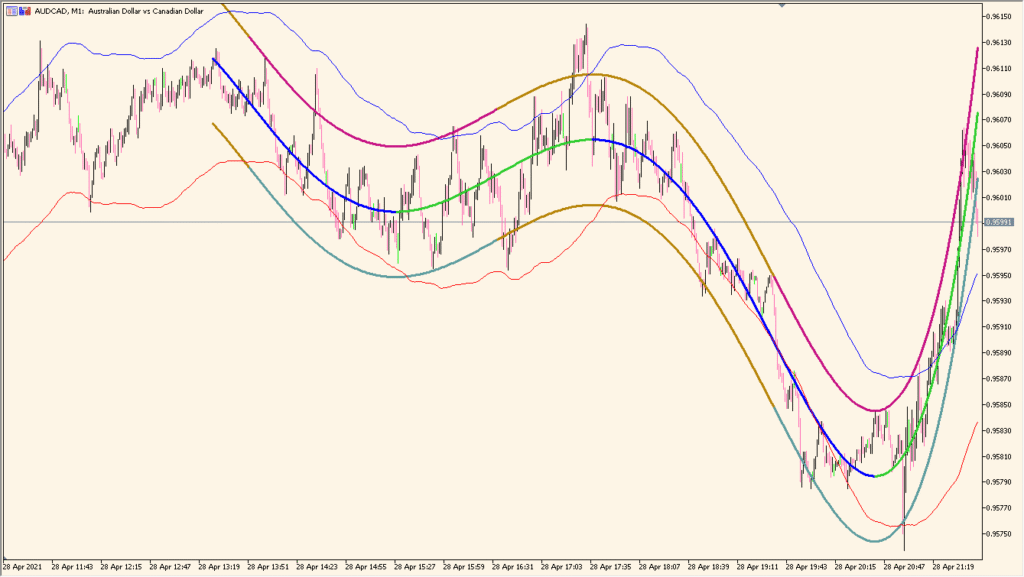
In live trading, the Regression Channel 2.0 can be used to:
- Identify the prevailing trend by observing the slope of the central regression line.
- Find potential reversal or pullback zones when price approaches the upper or lower band.
- Filter trades by aligning entries with the direction of the regression slope.
- Evaluate volatility through the width of the channel — wider channels signal higher market variability.
Because the channel adapts to recent data, it works well for traders looking to combine trend analysis with statistical deviation.
Best Settings & MT5 Parameters for Regression Channel 2.0
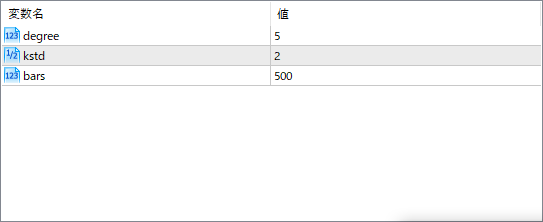
degree
Controls the degree of the polynomial used to create the regression line. Higher values make the line more curved and sensitive to price swings, while lower values keep it smoother.
kstd
Sets the number of standard deviations used to draw the upper and lower boundaries. Increasing this value widens the channel, capturing more price movement.
bars
Defines how many historical bars are used in calculating the regression. More bars give a broader view of price behavior, while fewer bars make the channel react faster to recent changes.