What is RSI Divergence Indicator?
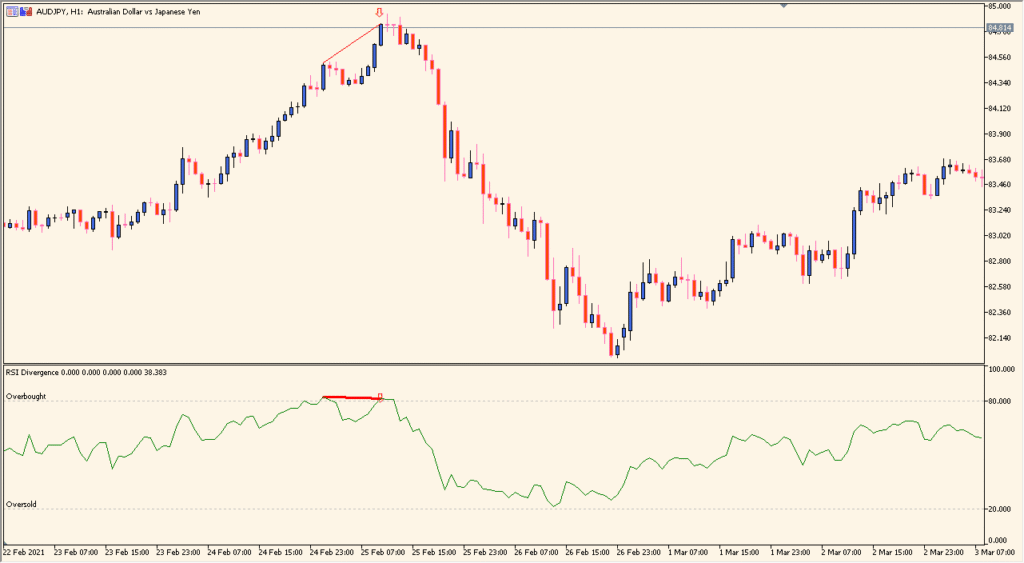
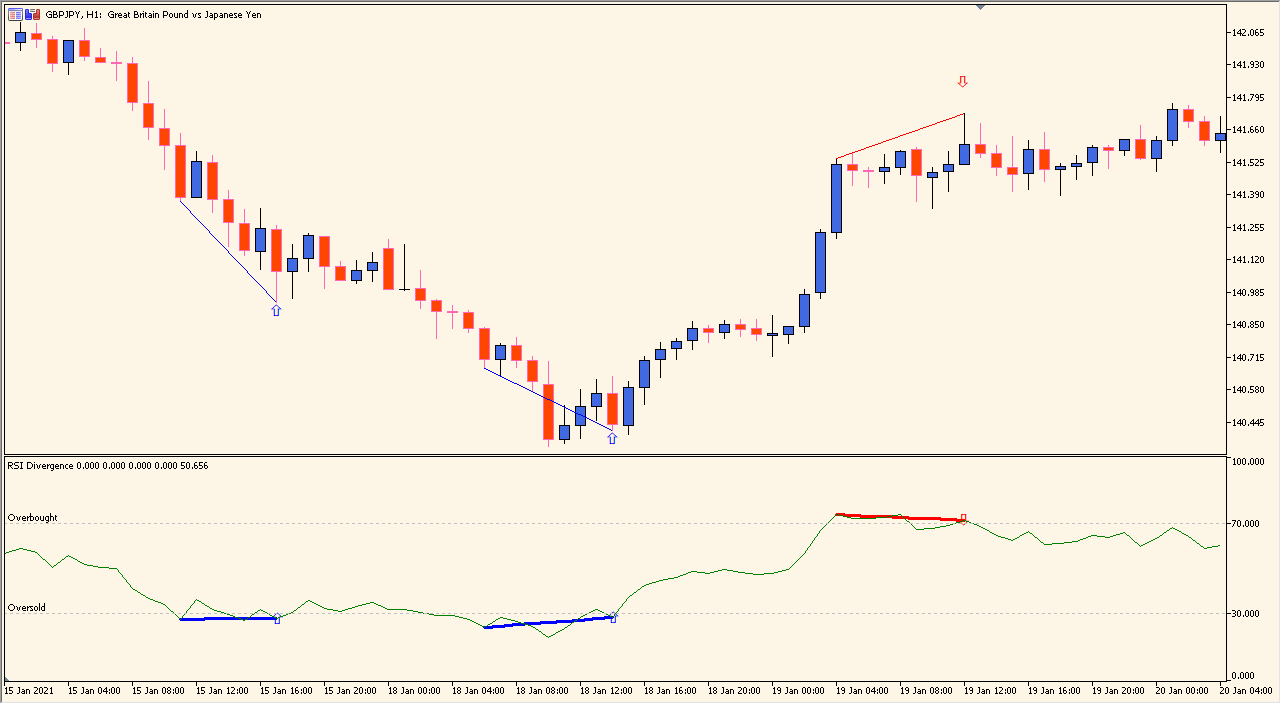
The RSI Divergence Indicator helps traders detect bullish and bearish divergences between price and the Relative Strength Index (RSI). These divergences often signal potential trend reversals or exhaustion points. By automatically drawing divergence lines and color-coding bullish and bearish patterns, this tool simplifies a traditionally manual process.
It uses standard RSI calculation and applies logical comparisons between RSI peaks/troughs and price action to identify hidden and regular divergences. Visual cues on the chart allow for quick decision-making without deep manual analysis.
How to Use It in Practice
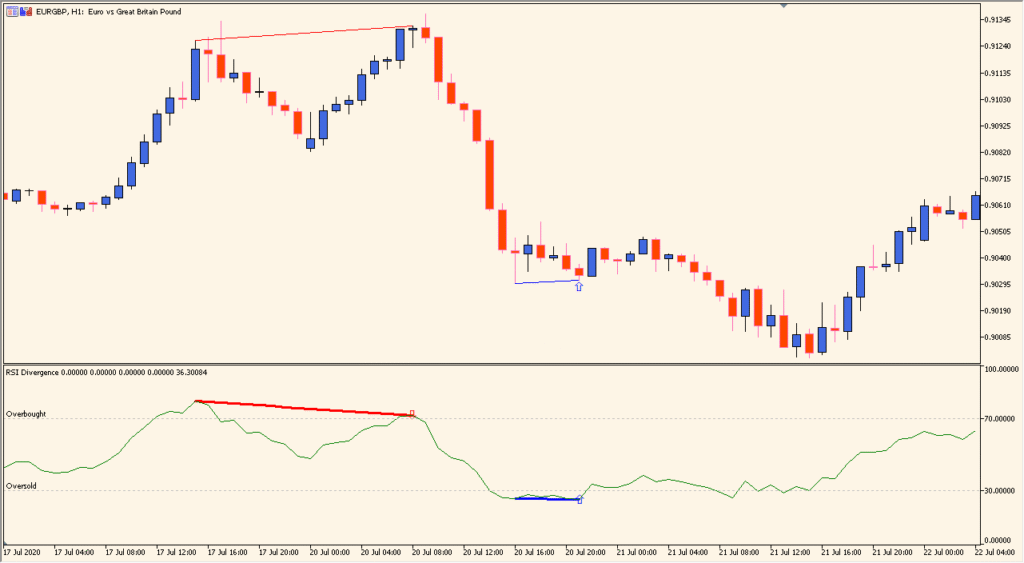
In live trading, you can use the RSI Divergence Indicator to:
- Identify early signals of potential reversals in uptrends or downtrends.
- Spot regular and hidden divergences without manually drawing trendlines.
- Confirm signals from other indicators (e.g., MACD, trendlines) with RSI divergence.
- Improve entry and exit timing based on momentum shifts.
This indicator is especially useful for swing and reversal traders looking for early trend-change hints.
Best Settings & MT5 Parameters for rsi-divergence-indicator
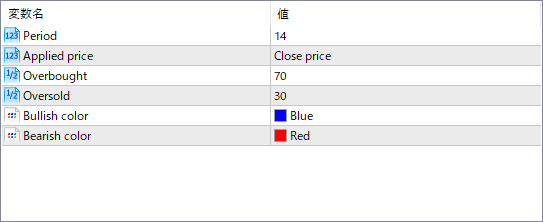
Period
Defines the number of bars used to calculate the RSI. Shorter periods make the indicator more sensitive; longer periods smooth out signals.
Applied price
Specifies which price is used in the RSI calculation. Common options include Close, Open, High, Low, etc.
Overbought
Sets the RSI level considered overbought. This is used to detect potential bearish divergences.
Oversold
Sets the RSI level considered oversold. This helps detect potential bullish divergences.
Bullish color
Defines the color of the lines or markers that highlight bullish divergence patterns.
Bearish color
Defines the color of the lines or markers that indicate bearish divergence patterns.