What is rsi-on-chart Indicator?
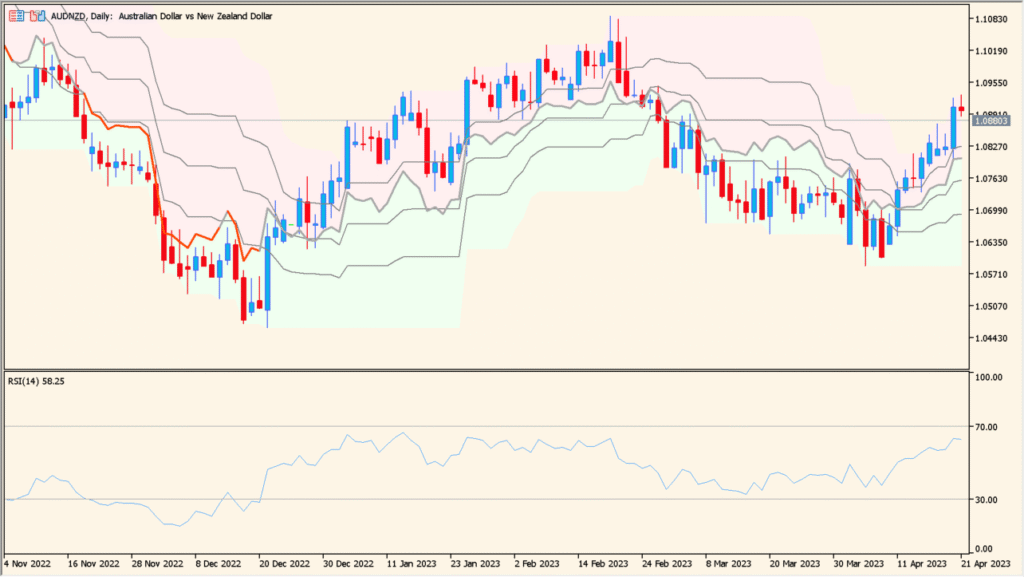
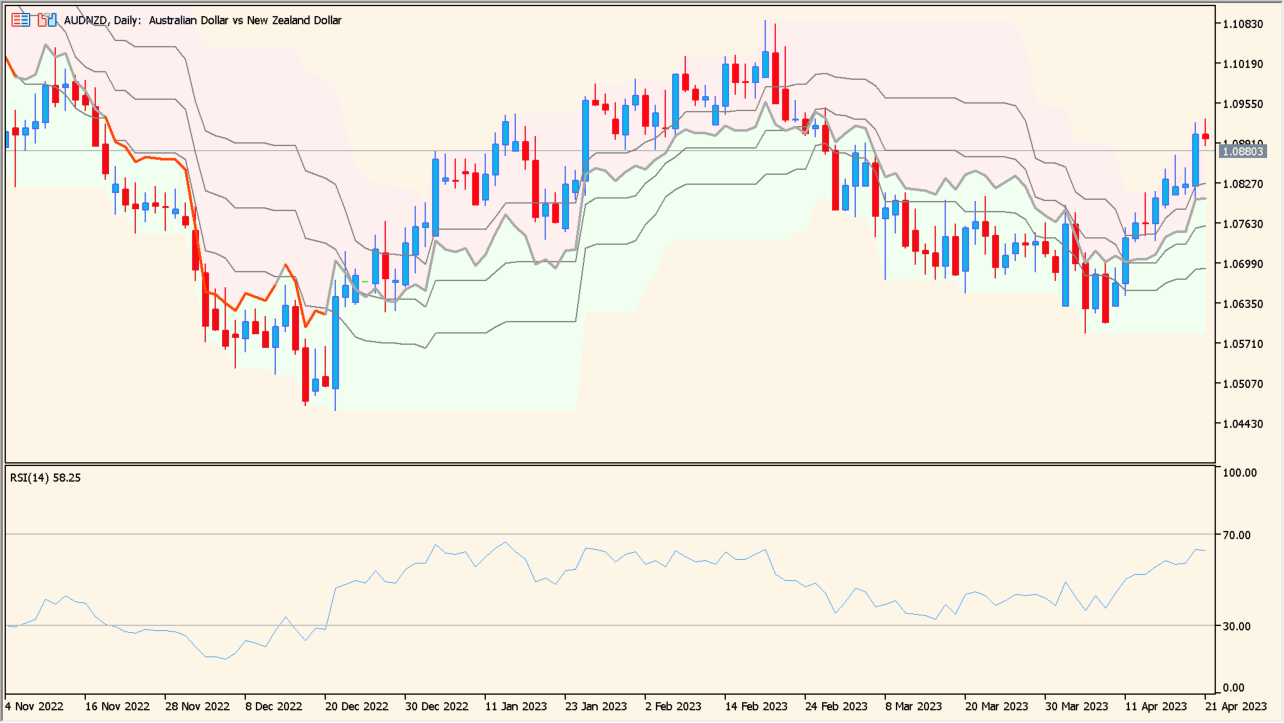
RSI on Chart is an indicator that overlays RSI-based information directly on the price chart instead of showing it in a separate subwindow. By visualizing overbought and oversold conditions around price, it helps traders understand momentum and exhaustion in a more intuitive way.
The indicator calculates RSI and projects its relative position using dynamic bands derived from recent highs and lows. Color changes are used to highlight overbought and oversold zones, making market conditions easy to read at a glance.
How to Use It in Practice
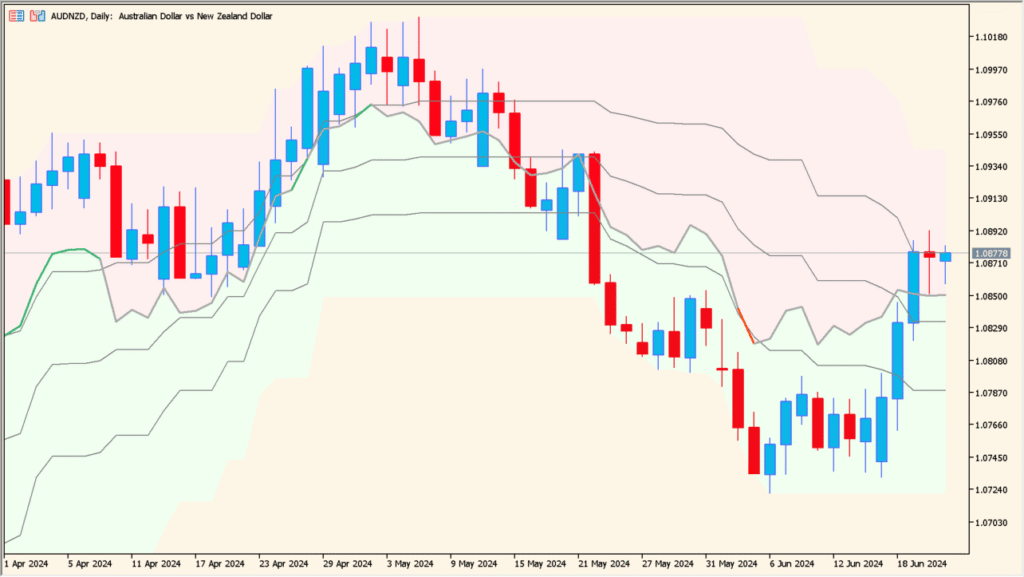
In practical trading, this indicator can be used as follows:
- Identify overbought areas when price moves into the upper colored zone.
- Identify oversold areas when price enters the lower colored zone.
- Watch for potential reversals when price exits these zones.
- Combine with trend analysis to avoid taking counter-trend signals in strong markets.
Because RSI information is displayed on the main chart, it works well for traders who prefer a clean layout without switching attention between multiple panels.
Best Settings & MT5 Parameters for rsi-on-chart
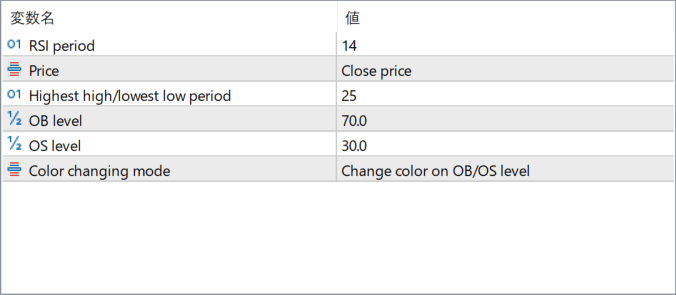
RSI period
Defines the number of bars used to calculate the RSI value. Shorter periods make the indicator more sensitive, while longer periods smooth the movement.
Price
Specifies which price type is used for the RSI calculation, such as close price.
Highest high/lowest low period
Sets the lookback range used to determine the dynamic upper and lower boundaries based on recent price extremes.
OB level
Defines the RSI level considered overbought. When exceeded, the indicator highlights this condition on the chart.
OS level
Defines the RSI level considered oversold. When price action aligns with this level, oversold conditions are emphasized.
Color changing mode
Controls how colors change when RSI reaches overbought or oversold levels, helping visually distinguish market states.