Overview of the RSI with Fibonacci Auto Channel
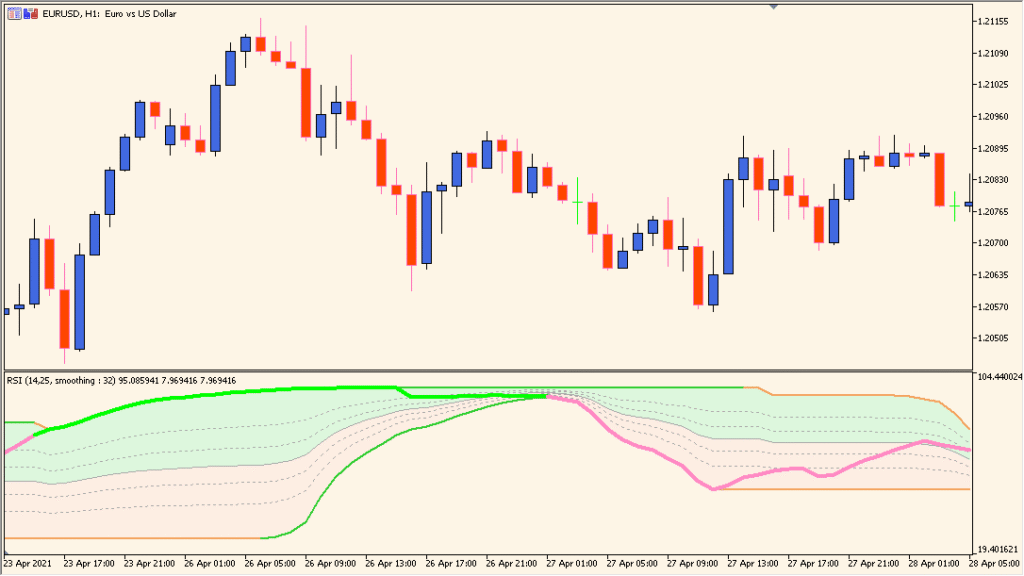
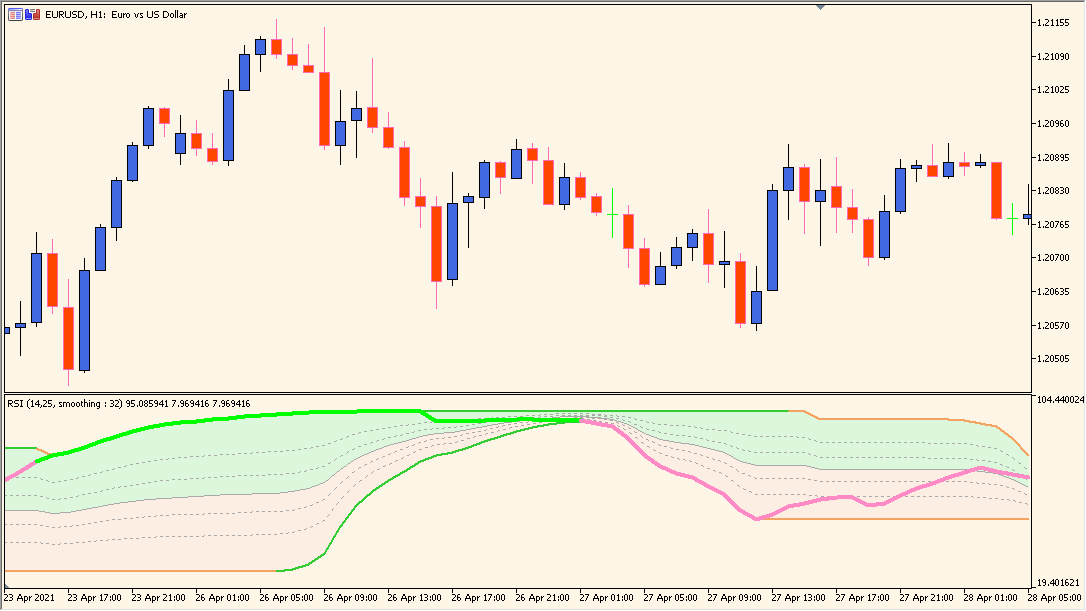
The RSI with Fibonacci Auto Channel indicator combines the classic Relative Strength Index (RSI) with an automatically drawn Fibonacci-based channel. It smooths RSI data and plots adaptive Fibonacci bands to visualize potential support and resistance zones within the RSI space. This helps traders identify overbought and oversold areas with a more dynamic range than traditional RSI levels.
By using a smoothed RSI curve and Fibonacci scaling, the indicator adjusts to market volatility and highlights how strong or weak the current trend momentum is. It’s especially helpful for traders who use RSI divergence or channel breakout strategies.
How to Use It in Practice
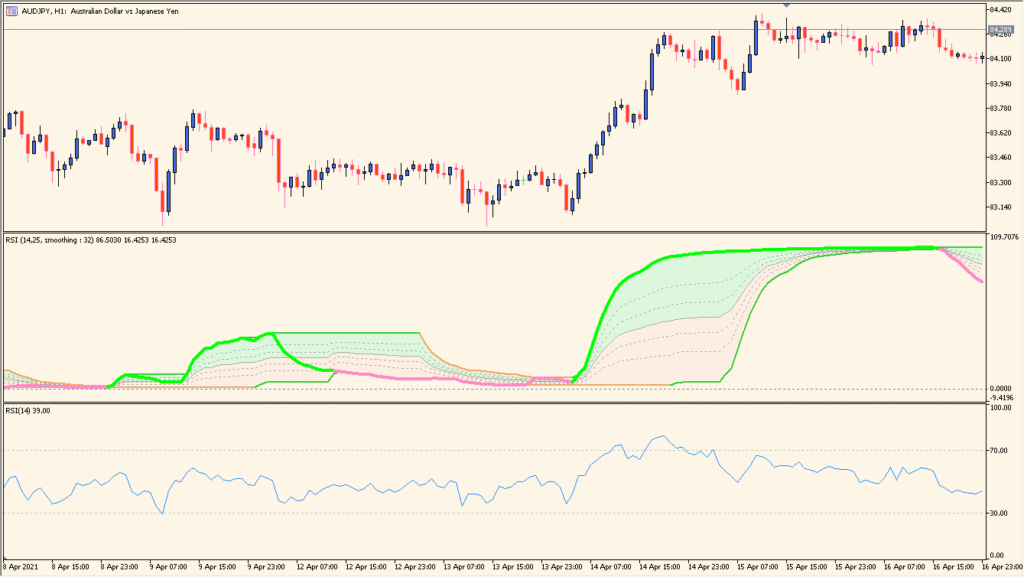
In trading, you can use the RSI with Fibonacci Auto Channel to:
- Identify overbought and oversold levels more dynamically compared to fixed RSI thresholds (70/30).
- Watch for price reactions when RSI touches or breaks Fibonacci channel levels.
- Use RSI divergence with channel edges to anticipate possible reversals.
- Combine with price-based Fibonacci tools for confluence confirmation.
This indicator is useful for swing and intraday traders who rely on momentum shifts and want smoother, adaptive RSI readings.
Best Settings & MT5 Parameters for rsi-with-fibonacci-auto-channel
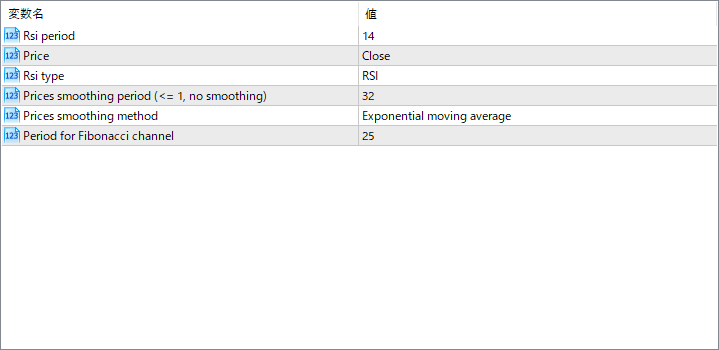
Rsi period
Defines the number of periods used to calculate the RSI. A shorter period increases sensitivity, while a longer one provides smoother output.
Price
Specifies which price data is used in the RSI calculation, such as Close, Open, or Median.
Rsi type
Determines the RSI calculation method. Options may include standard RSI, Stochastic RSI, or other variations.
Prices smoothing period
Sets how many periods are used to smooth the RSI values. A higher number produces a gentler, less noisy curve.
Prices smoothing method
Chooses the averaging method applied to smoothing, such as Exponential Moving Average or Simple Moving Average.
Period for Fibonacci channel
Defines the lookback period used to construct the Fibonacci channel. It affects how wide or narrow the channel bands appear around the RSI curve.