What is RSI Overview Indicator?
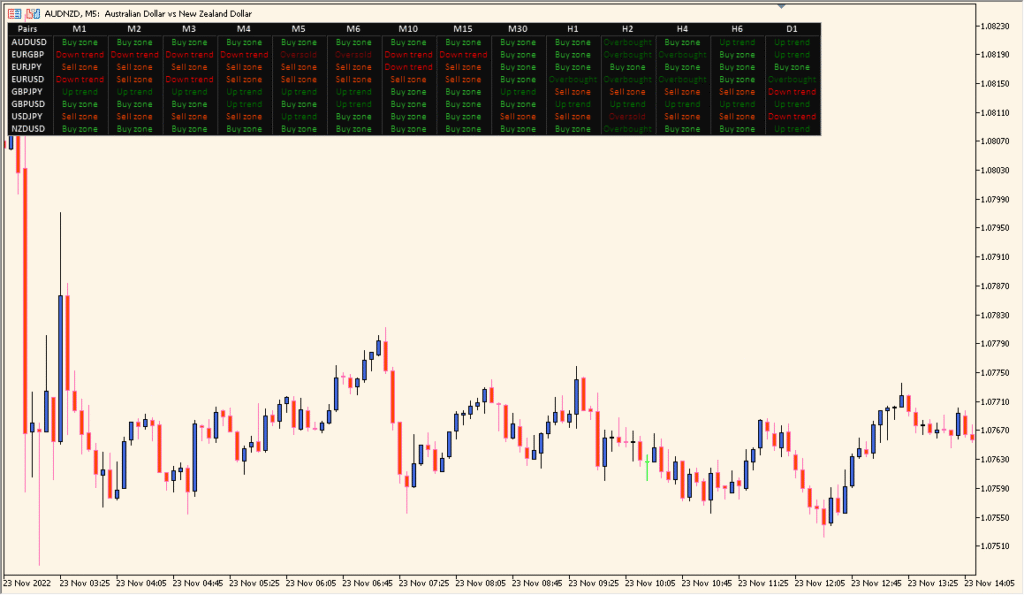
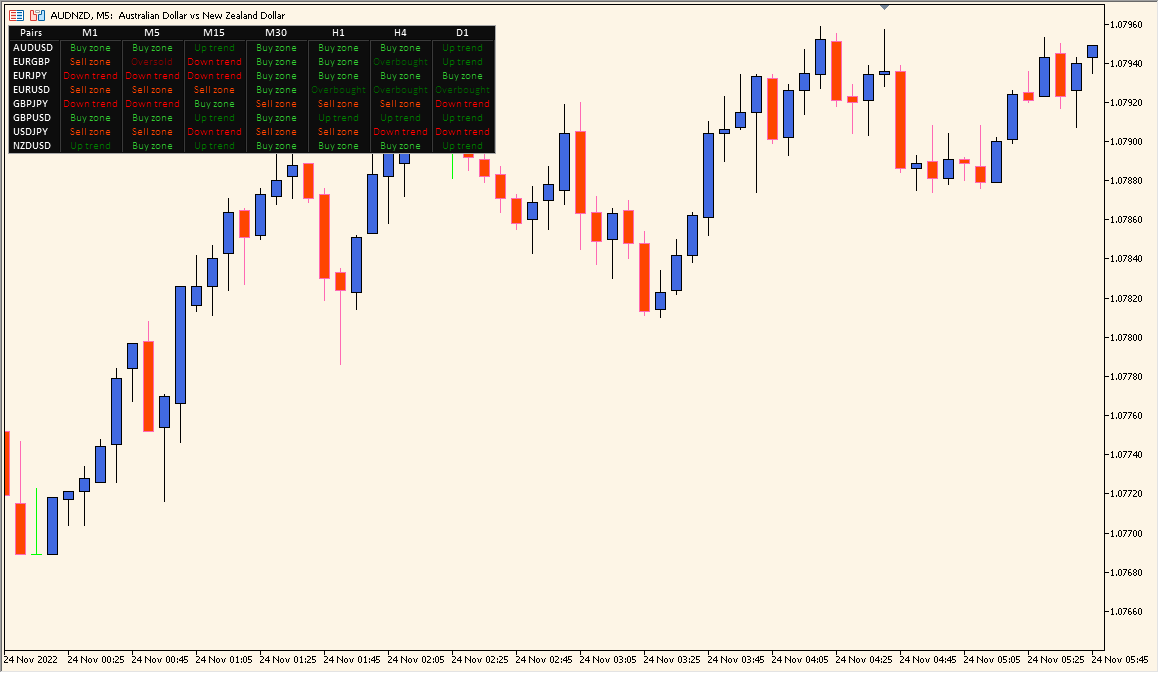
The RSI Overview indicator for MT4 provides a compact dashboard that displays RSI conditions across multiple timeframes and currency pairs. It helps traders instantly see where each pair is overbought, oversold, or trending, without switching charts. This tool is especially helpful for multi-pair traders who rely on RSI signals for entry timing and momentum confirmation.
By combining RSI readings from various timeframes into one view, it simplifies the process of spotting alignment between short-term and long-term momentum conditions. The panel shows whether a symbol is in a bullish zone, bearish zone, or within neutral territory based on RSI values.
How to Use It in Practice
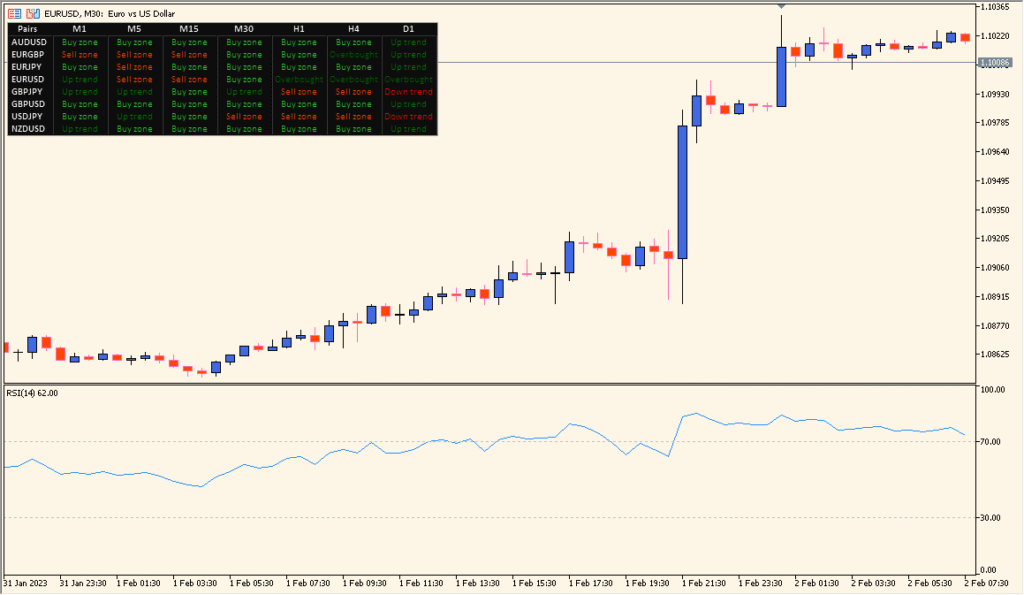
In live trading, use the RSI Overview indicator to:
- Monitor multiple symbols and timeframes simultaneously to detect overbought or oversold conditions.
- Find RSI alignment across different periods to confirm stronger trade setups.
- Quickly identify pairs that are shifting from neutral to trending RSI zones.
- Use it as a supporting tool for momentum-based entries or exits.
This indicator is ideal for traders who want to maintain situational awareness across several pairs while focusing on RSI-based momentum analysis.
Best Settings & MT5 Parameters for RSI_Overview
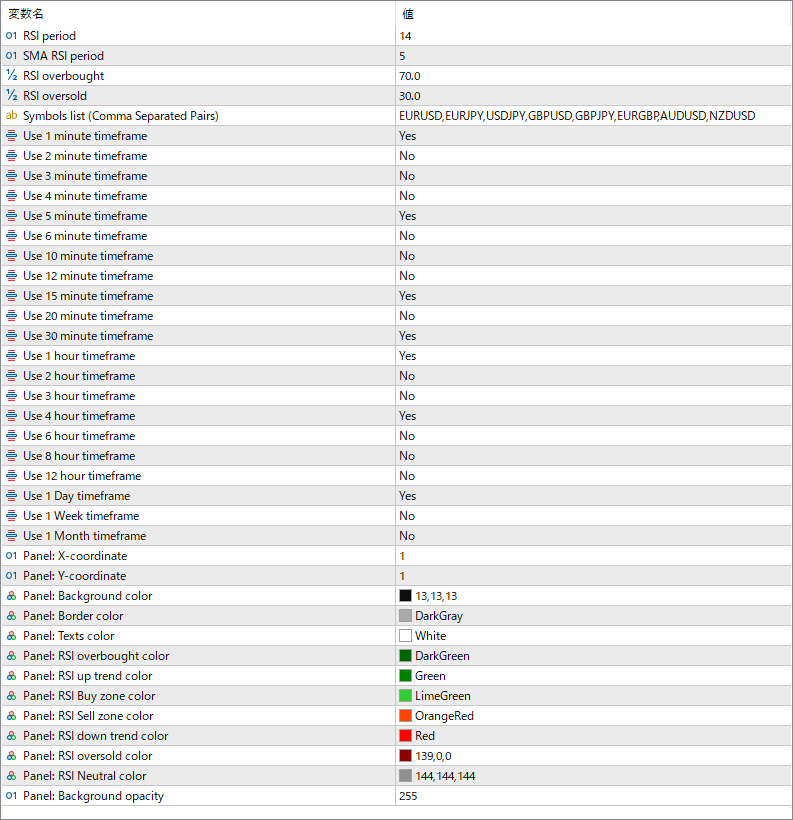
RSI period
Defines the number of bars used to calculate the Relative Strength Index. Adjusting this value changes how sensitive the RSI is to recent price movements.
SMA RSI period
Sets the period for smoothing the RSI values using a simple moving average. This helps reduce noise in the displayed readings.
RSI overbought
Specifies the upper threshold where the RSI is considered overbought. Typically used to identify potential sell conditions.
RSI oversold
Defines the lower threshold for oversold conditions, often signaling possible buy opportunities.
Symbols list
Lists all currency pairs to monitor, separated by commas. The indicator displays RSI data for each listed symbol.
Use X minute/hour/day timeframe
Enables or disables the display of specific timeframes in the dashboard. For example, enabling “Use 1 hour timeframe” shows RSI data from the H1 chart. This allows customization of the time horizon shown in the overview panel.