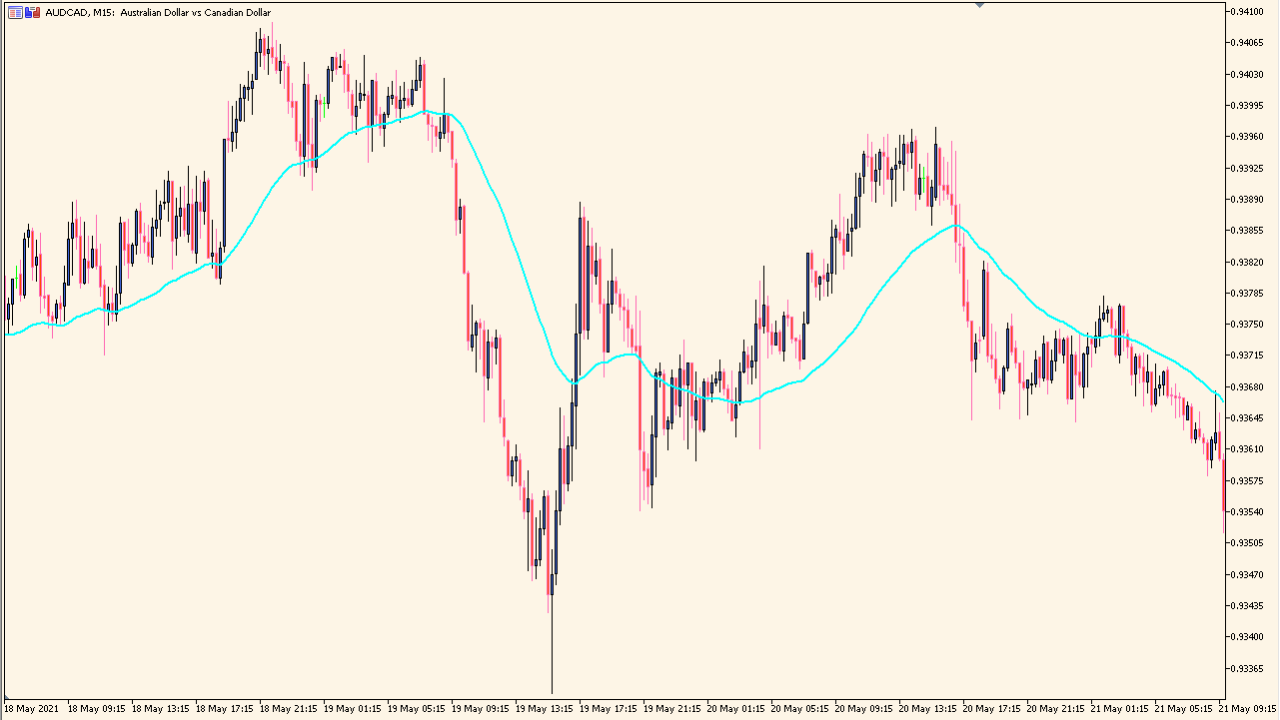
What is 3rdGenMA?
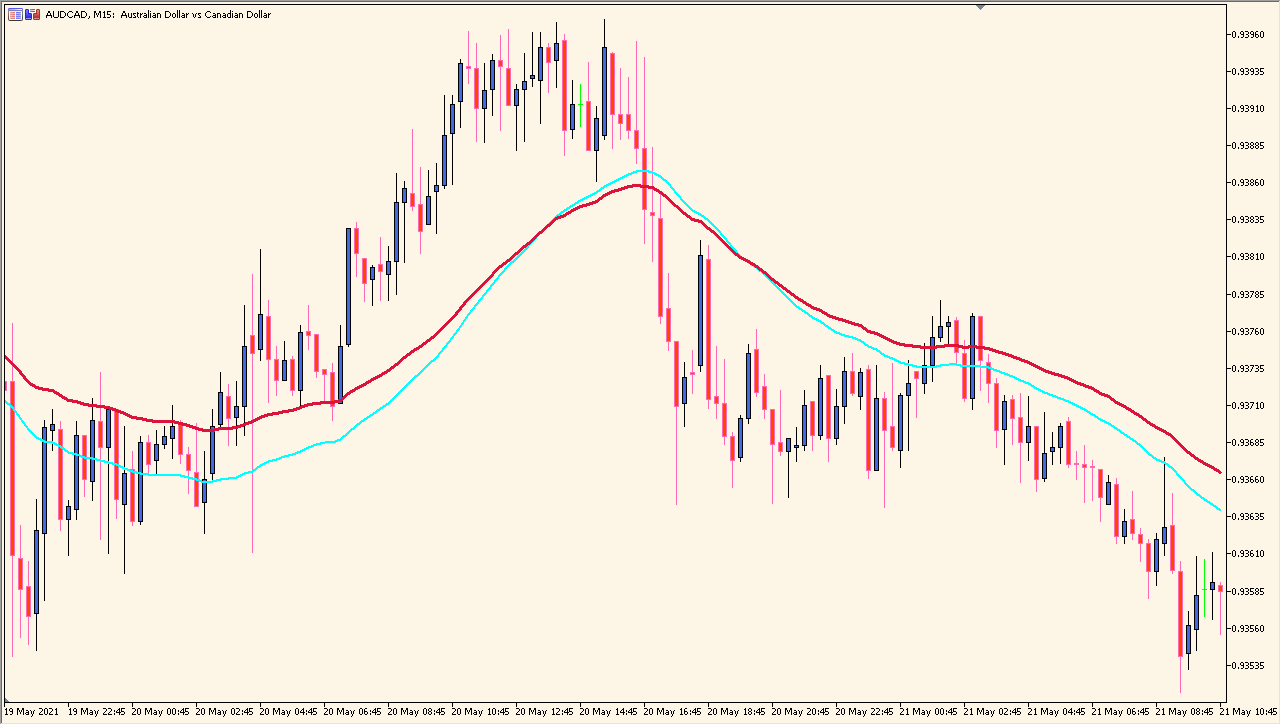
3rdGenMA is an MT4 indicator that displays a smoothed moving-average line designed to remain responsive to recent price changes.
The line uses a primary MA period and a longer sampling period, with method and applied-price options controlling the displayed calculation. Compare its slope and position with recent price structure as chart context.
How to use 3rdGenMA
Compare the third-generation moving-average line with the EMA and adjust its sampling response when needed:
- Place the line on the chart and compare its response with a standard EMA over the same movement.
- Use MA_Period to set the moving-average period.
- Use MA_Sampling_Period to make the line smoother or more responsive to shorter price changes.
- Note that reducing lag can also make small fluctuations more visible, so compare the line with the chart’s broader movement.
Where it helps
Smoothing creates a single directional reference, configurable periods adjust the observation window, and method or applied-price settings support different chart contexts.
MT4 Indicator Parameters
The table below lists the available MT4 indicator parameters. You can customize these options in the MetaTrader Inputs dialog to match your trading preferences.
| Parameter | Description |
|---|---|
| MA_Period | Sets the primary moving-average period. Default: 50. |
| MA_Sampling_Period (should be more than 4 * MA_Period) | Sets the longer sampling period. Default: 220. |
| MA_Method | Selects the moving-average method. Default: Exponential. |
| MA_Applied_Price | Selects the applied price. Default: Typical price. |
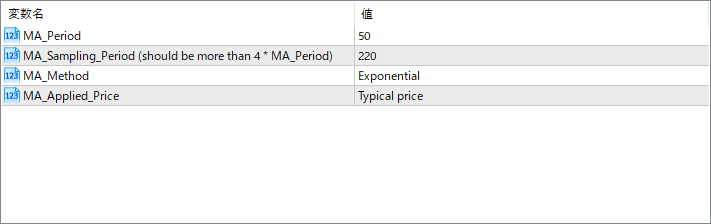
The screenshot above shows the default input parameters in the MT4 settings window.
How to Install .ex4 Indicator in MetaTrader 4
- Download the ZIP file and extract it.
- In MT4, select File → Open Data Folder.
- Open MQL4 → Indicators and copy the EX4 or MQ4 file into it.
- If the package includes library files, copy them to MQL4 → Libraries. Copy TPL files to the top-level templates folder.
- Restart MT4, find the indicator in the Navigator, and drag it onto a chart.
Test the tool on a demo account first. File contents and required folders can vary between packages.


