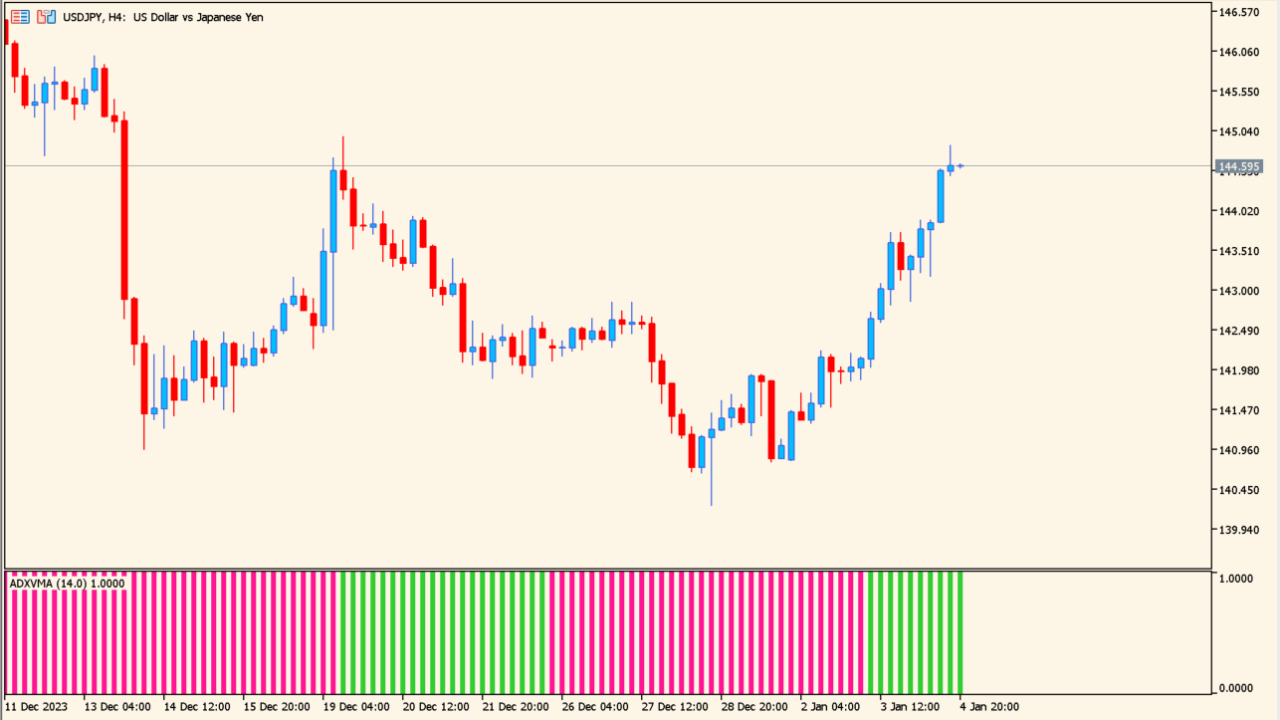
What is adx-yma-histogram Indicator?
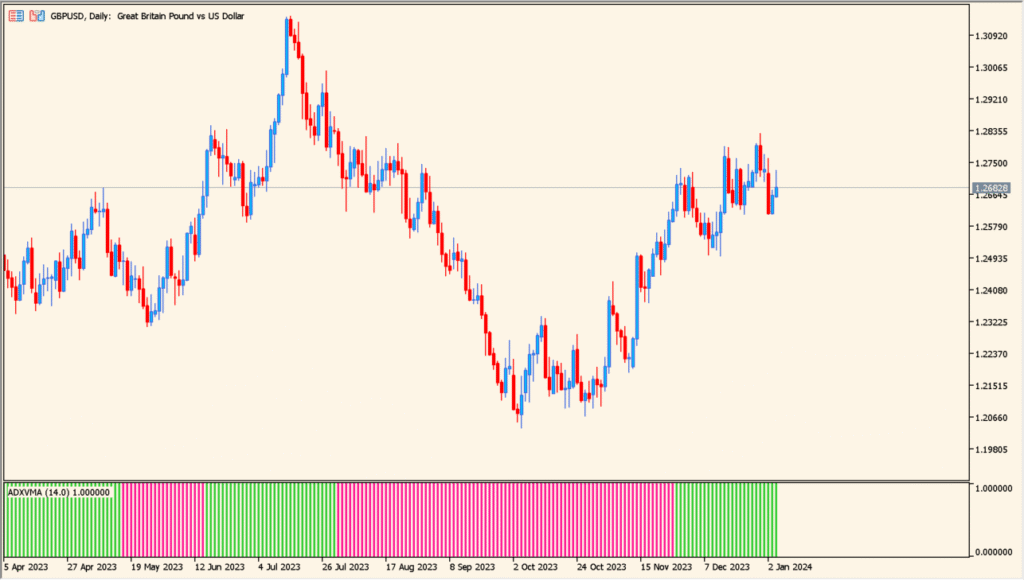
ADX YMA Histogram is an MT5 subwindow indicator that displays an ADX-based strength value as a smoothed histogram. Period, YMA smoothing, colors, and reference levels control the visible response.
The histogram helps compare stronger, weaker, and flatter periods without relying on several separate lines. It measures displayed strength and does not establish market direction by itself.
How to Use It in Practice
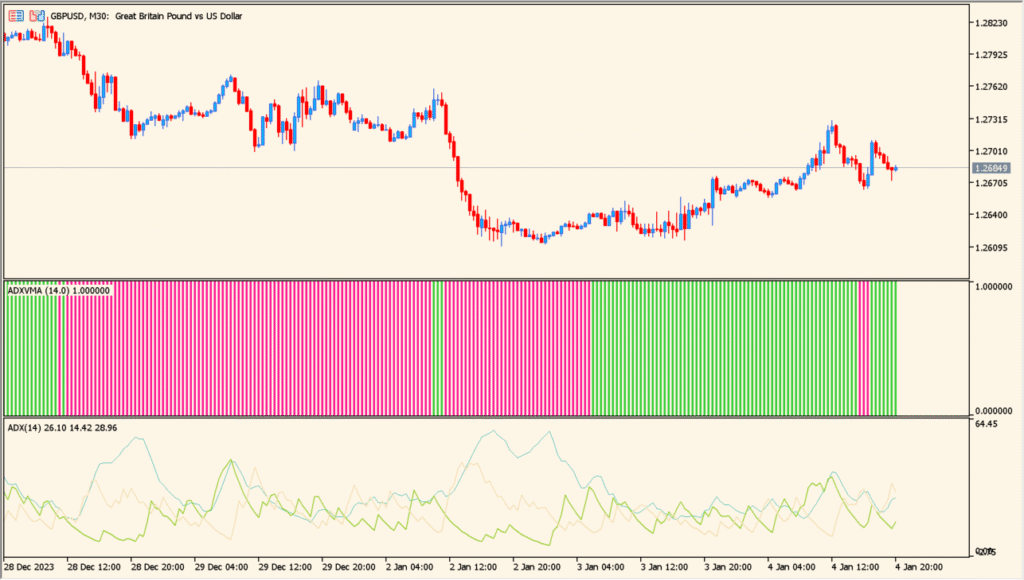
Compare the simplified green and red histogram with the fuller ADX view when reviewing changes in the displayed state:
Smoothed strength is easy to scan in one pane, reference levels organize comparison, and inputs support different sensitivities.
- Read green bars as the displayed rising state and red bars as the displayed falling state, then compare each change with the main price chart.
- Place the ordinary ADX alongside the histogram when needed to compare the simplified display with ADX, +DI, and -DI lines.
- Keep the subwindow compact if desired; MT5 can reduce it enough that it does not dominate the main chart.
- Because the response is quick and may differ by currency pair, compare the histogram over several examples for that symbol rather than relying on a single color change.
MT5 Indicator Parameters
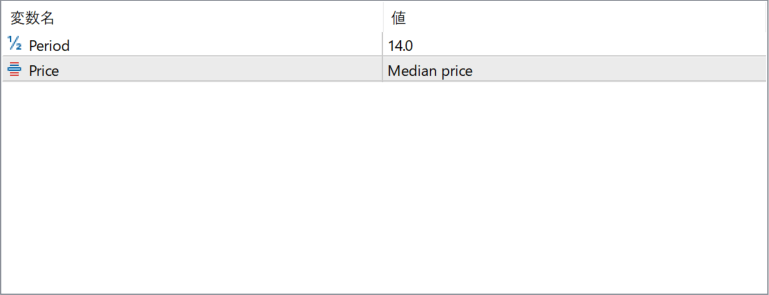
The screenshot above shows the default input parameters in the MT5 settings window.
| Parameter | Description |
|---|---|
| Period | Defines the calculation length used for the ADX-based smoothing. Shorter periods react faster to changes in strength, while longer periods provide a more stable view. |
| Price | Selects the price source used in the calculation, such as median price. Different price inputs slightly change the responsiveness of the histogram. |


