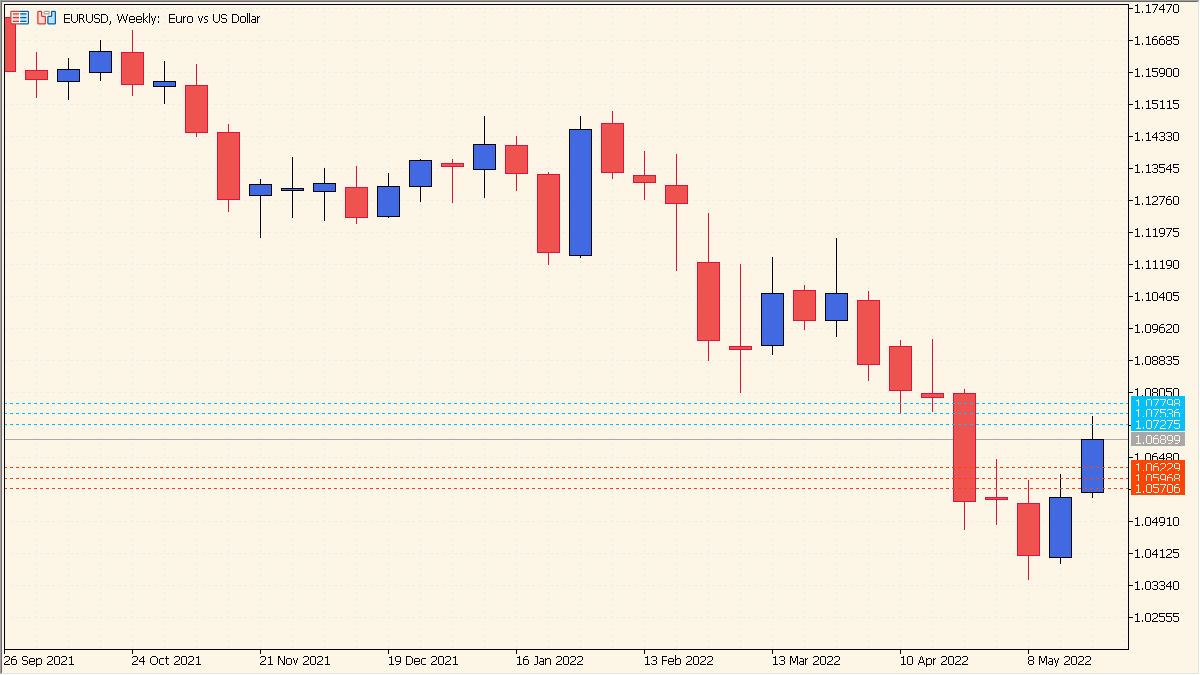
What is ATR Probability Levels Indicator?
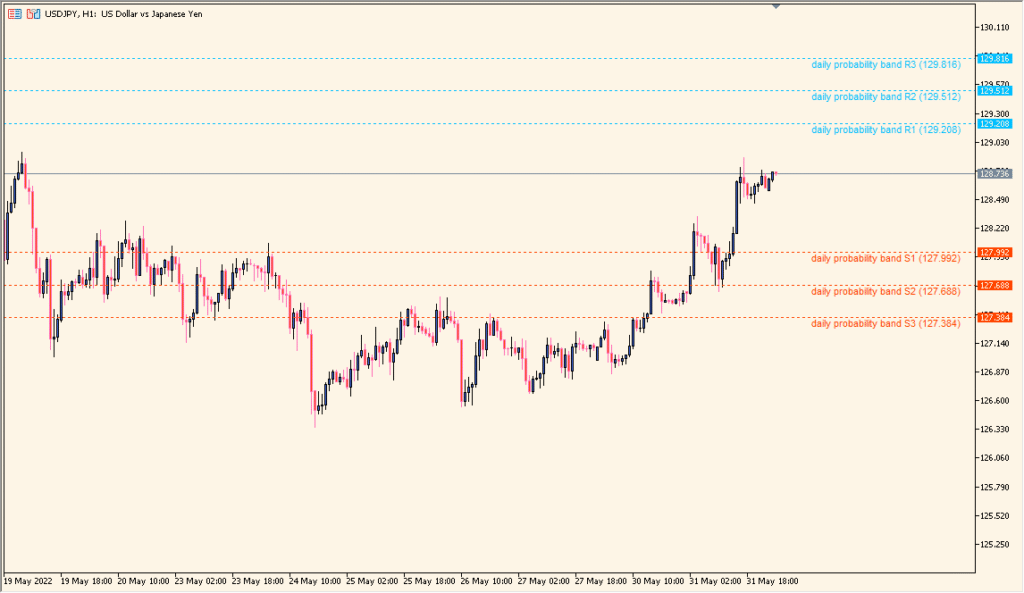
ATR Probability Levels is an MT5 chart indicator that plots upper and lower daily range references from Average True Range calculations. ATR period, level multipliers, session settings, colors, and line styles control the display.
The bands provide visual context for comparing current price with the selected volatility sample. They are reference ranges for chart review and do not describe a fixed path or destination.
How to Use It in Practice
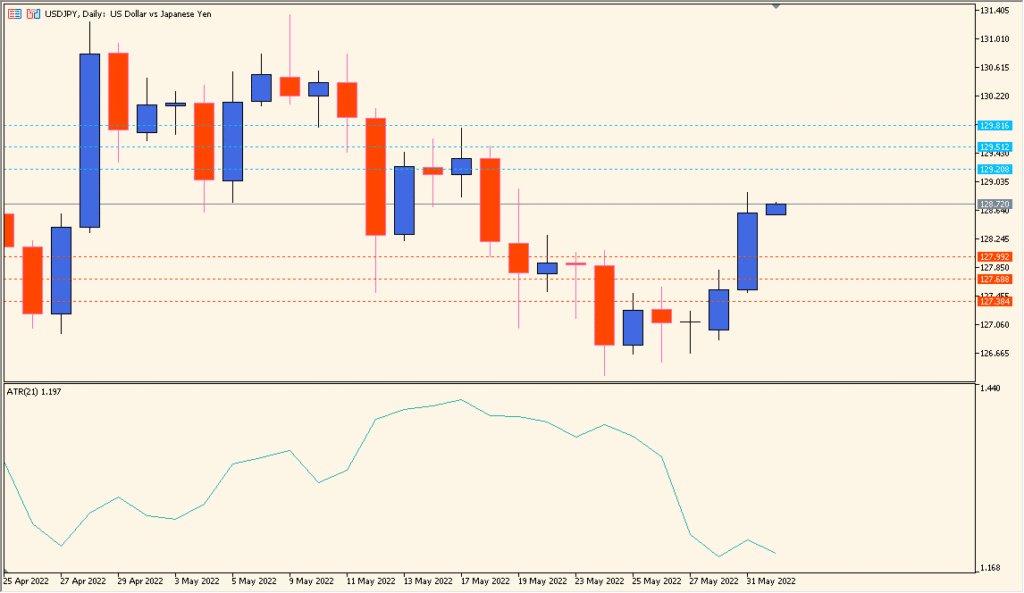
Three cyan lines above and three red lines below the current price show ATR-based range references for the selected period. These are range guides for the current day or selected timeframe, not lines to read back through historical bars.
- Read the six colored lines against the candles belonging to the current selected period.
- Set Timeframe for data to choose the period represented by the lines, including H4 and H1.
- Move Labels shift right with a larger value or left with a smaller or negative value.
- Do not analyze old price history against these lines, because each set is only a guide for that period’s range.
ATR-based daily references are drawn automatically, multiple level settings support comparison, and colors keep the bands easy to distinguish.
MT5 Indicator Parameters
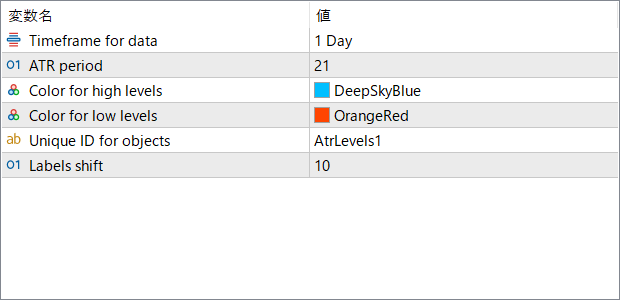
The screenshot above shows the default input parameters in the MT5 settings window.
| Parameter | Description |
|---|---|
| Timeframe for data | Specifies the timeframe used to calculate the ATR-based probability levels. For example, “1 Day” uses the daily ATR to project the day’s potential price range. |
| ATR period | Determines the number of periods used to calculate the Average True Range. A higher value smooths the levels and reduces sensitivity to short-term volatility. |
| Color for high levels | Sets the color of the upper ATR bands displayed on the chart. |
| Color for low levels | Sets the color of the lower ATR bands displayed on the chart. |
| Unique ID for objects | Defines a unique label identifier for the chart objects. Useful when using multiple instances of the indicator. |
| Labels shift | Moves the label position horizontally to avoid overlapping with price candles. |


