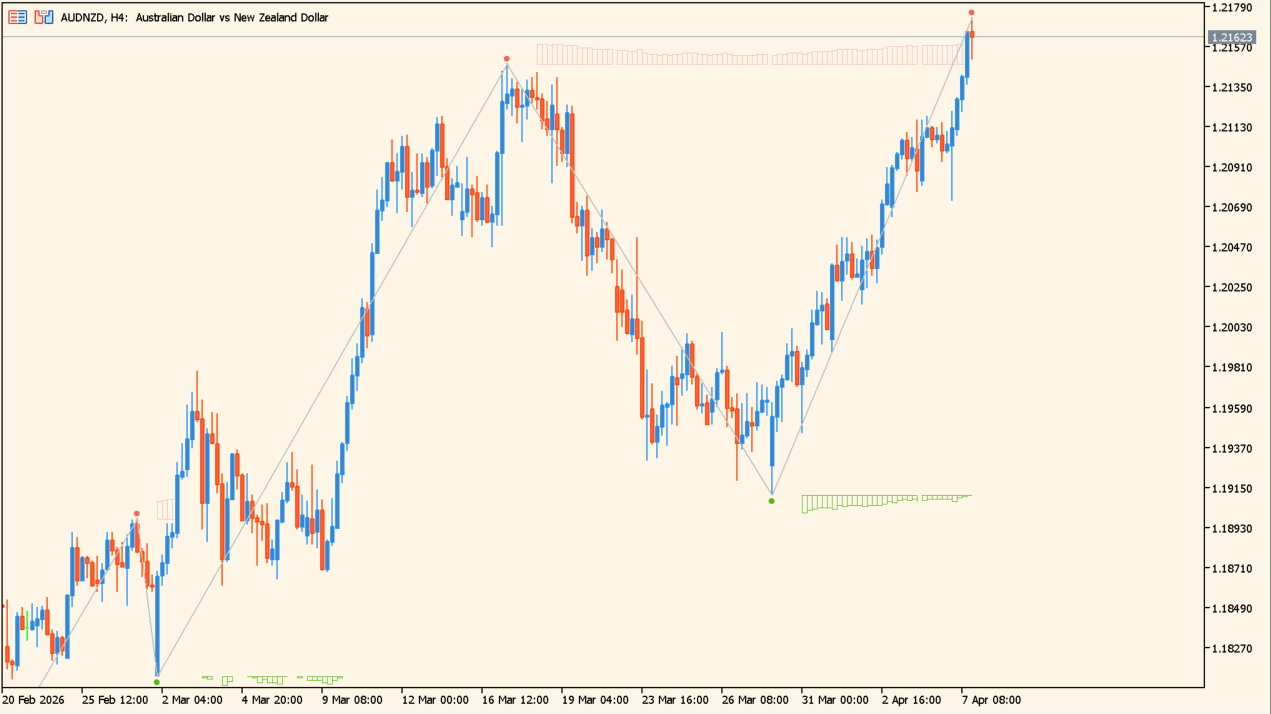
What is Auto Supply and Demand?
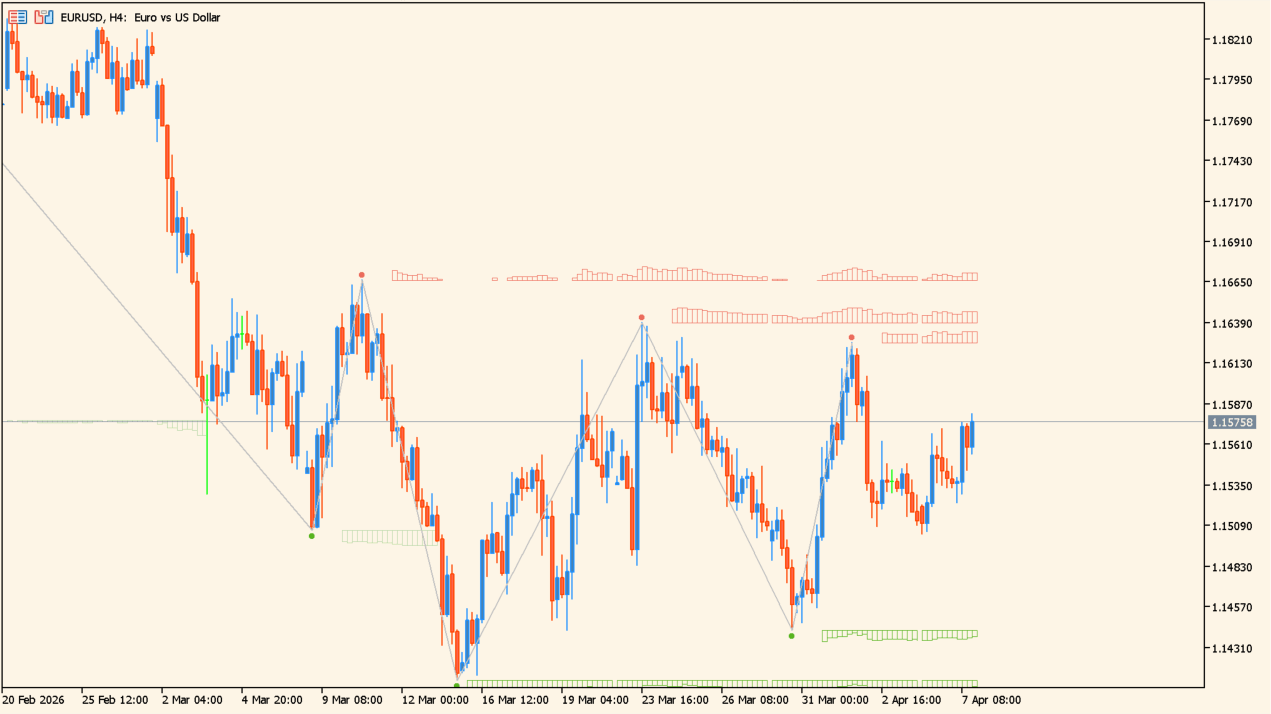
Auto Supply and Demand marks supply zones above price and demand zones below it, drawn from areas where price has reacted before.
A zigzag line runs over the highs and lows alongside the zones, so the swing structure is visible together with the marked areas. The strength of each zone is shown as a histogram.
How to use Auto Supply and Demand
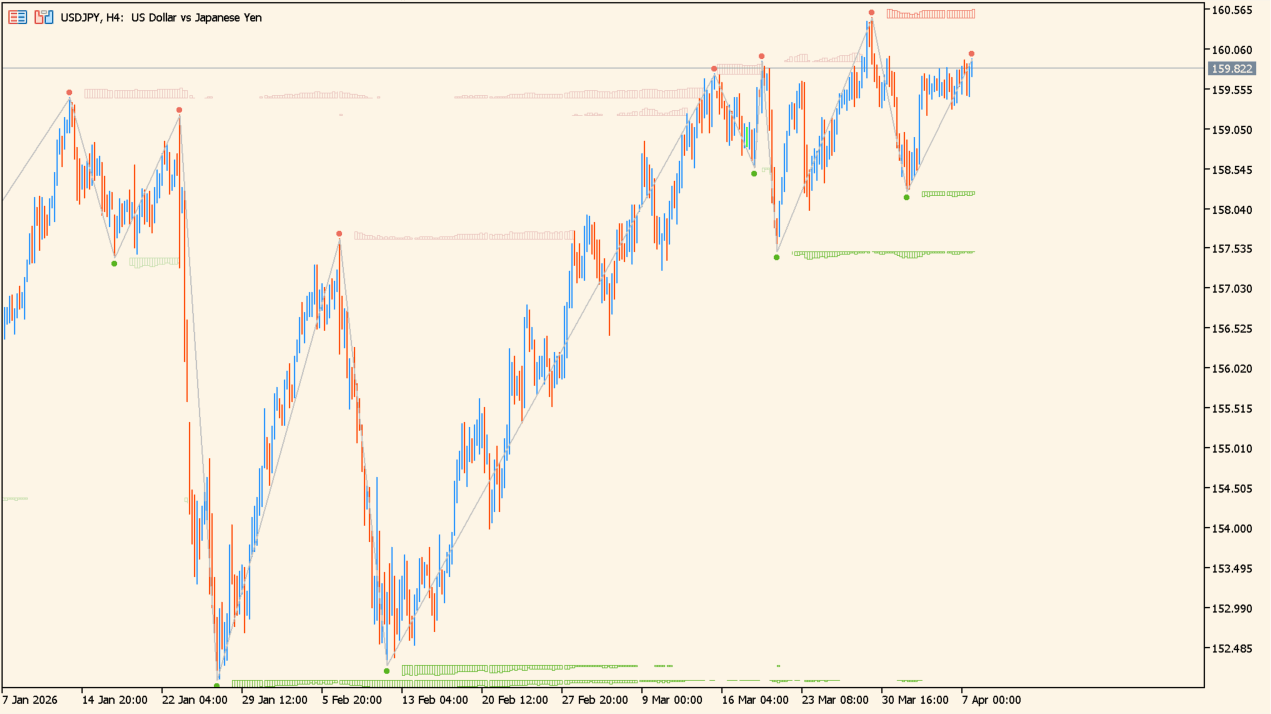
Compare the position of price with the marked zones. The zones are drawn as price ranges rather than single lines, so note where price enters a zone and how the candles behave inside it.
The height of the histogram shows the relative strength assigned to each zone, so thicker and thinner zones can be told apart. Read the zigzag alongside them to follow the sequence of highs and lows over the same period.
Where it helps
The areas are placed from earlier price reactions, so the levels appear without marking up the history by hand.
The histogram height distinguishes the zones, which gives a basis for comparing two areas on the same chart.
The zigzag covers the same period as the zones, so the swing highs and lows and the marked areas are read from a single display.
MT5 Indicator Parameters
The table below lists the available MT5 indicator parameters. You can customize these options in the MetaTrader Inputs dialog to match your trading preferences.
| Parameter | Description |
|---|---|
| ========== ZigZag settings: ========== | Section label. |
| Depth: | Sets the minimum price range used to identify ZigZag reversals. |
| Backstep: | Sets the bar interval used to confirm recent highs and lows. |
| ========== Indicator settings: ========== | Section label. |
| Number of bars to calculate: | Sets the number of historical bars used in the calculation. |
| Histogram height %: | Sets the histogram height percentage used to represent zone strength. |
| Bars used for calculating the histogram height: | Sets the number of bars used to calculate histogram height. |
| Infill histogram | Shows or hides the filled histogram. |
| ========== Display settings: ========== | Section label. |
| Mark Peaks and Lows: | Shows or hides marks at highs and lows. |
| Peaks and Lows Dot size: | Sets the dot size for highs and lows. |
| Draw ZigZag: | Shows or hides the ZigZag line. |
| Line ZigZag width: | Sets the ZigZag line width. |
| Line ZigZag type: | Sets the ZigZag line style. |
| ========== Presets ========== | Section label. |
| Preset colors: | Selects the color preset. |
| ========== Custom Color settings ========== | Section label. |
| Select Custom Preset to set Custom Colors | Enables or disables custom color settings. |
| ZigZag Color: | Sets the ZigZag line color. |
| Supply Color: | Sets the color of supply zones. |
| Supply Expired Color: | Sets the color of expired supply zones. |
| Demand Color: | Sets the color of demand zones. |
| Demand Expired Color: | Sets the color of expired demand zones. |
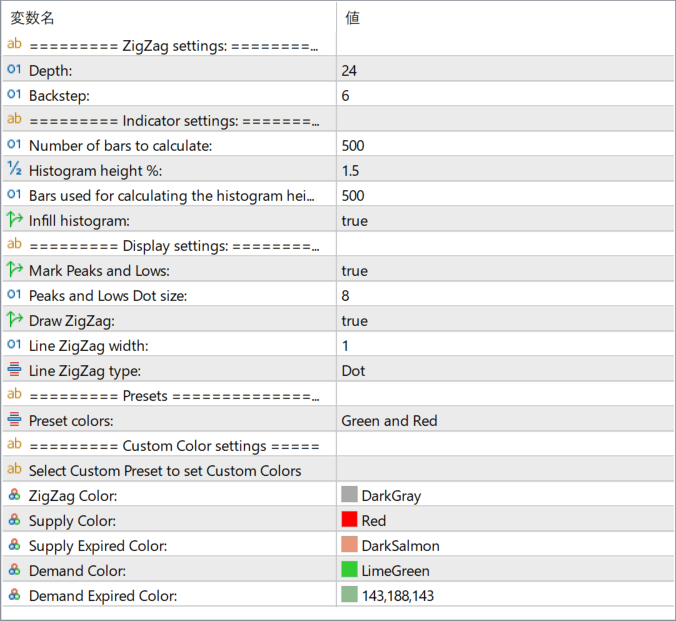
The screenshot above shows the default input parameters in the MT5 settings window.
How to Install .ex5 Indicator in MetaTrader 5
- Download the ZIP file and extract it.
- In MT5, select File → Open Data Folder.
- Open MQL5 → Indicators and copy the EX5 or MQ5 file into it.
- If the package includes library files, copy them to MQL5 → Libraries. Copy TPL files to the top-level templates folder.
- Restart MT5, find the indicator in the Navigator, and drag it onto a chart.
Test the tool on a demo account first. File contents and required folders can vary between packages.


