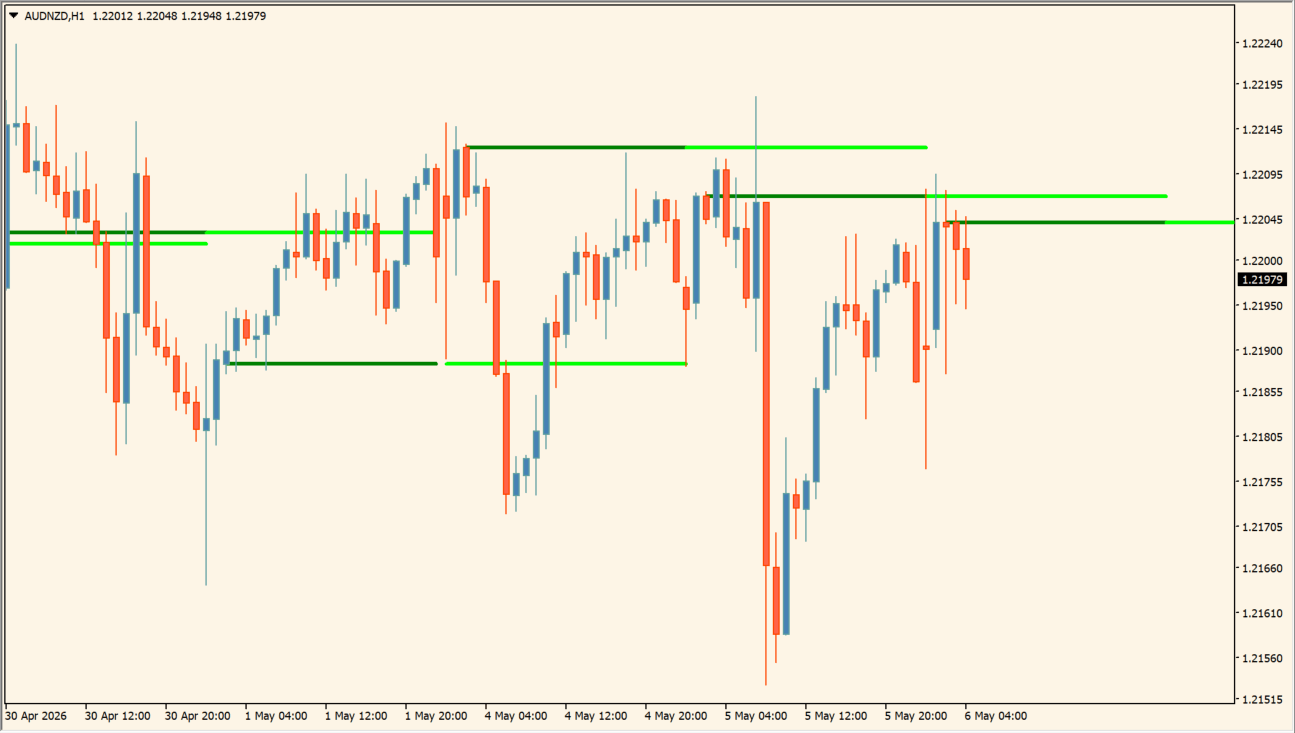
What is Bank Levels Indicator?
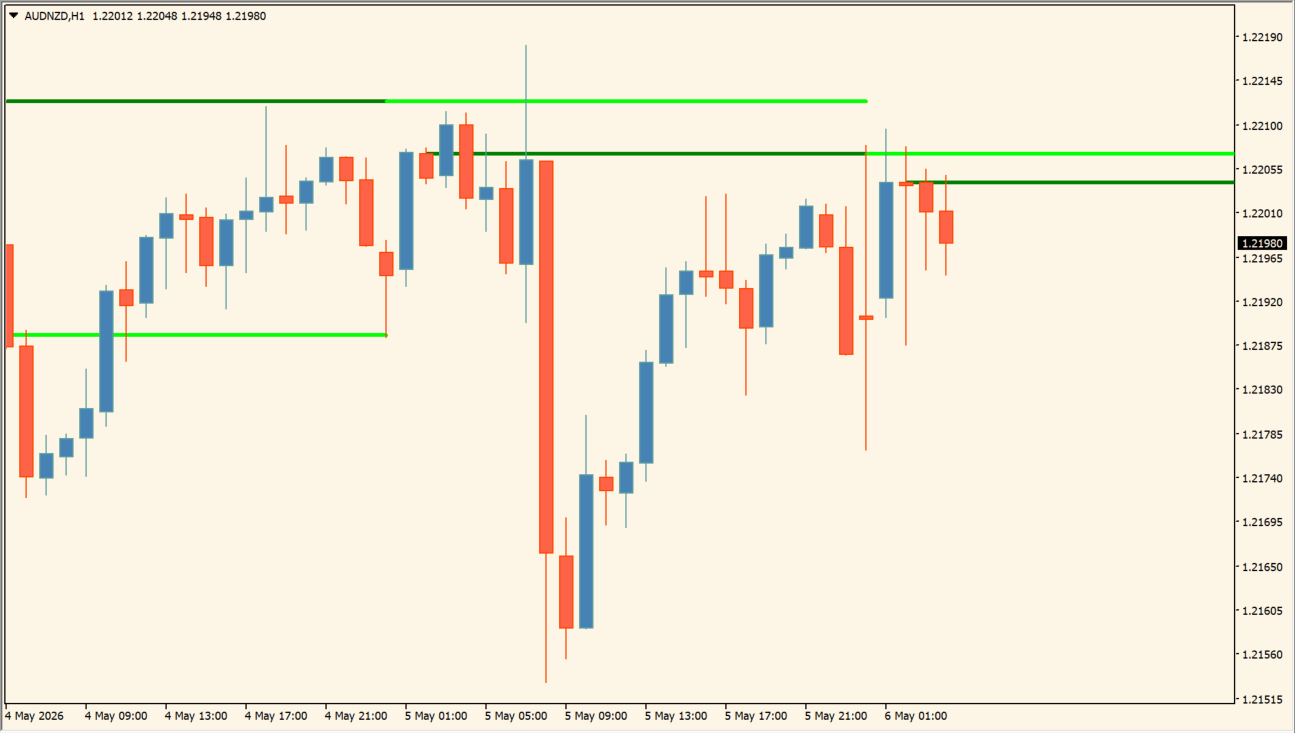
Bank Levels Indicator extracts daily highs and lows and draws them as horizontal reference lines. Current-day lines are drawn in darker colors, while next-day and historical lines use lighter colors.
The lines are displayed on H1 and lower timeframes. This makes the date-based reference levels available while retaining the current chart timeframe.
How to use Bank Levels Indicator
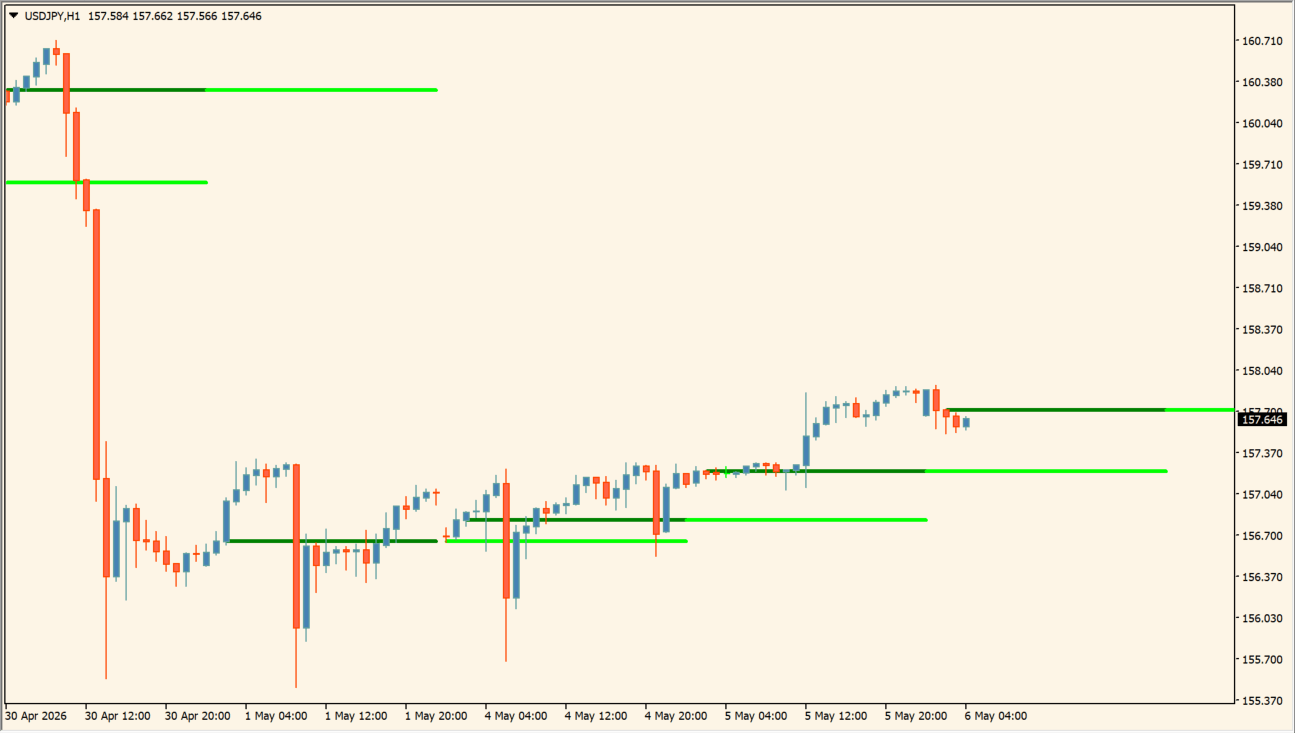
Compare the darker current-day lines with the lighter next-day and historical lines, then review their position against the candles on H1 or a lower timeframe. The lines are reference levels derived from daily data, not guaranteed reaction points.
StartHour sets the daily starting time used by the calculation, and Days_Ago changes how far back the data is examined. ColorCurrentDay, ColorNextDay, and LineWidth change the colors and thickness of the plotted lines.
Where it helps
Current-day and next-day lines use different color settings.
Days_Ago changes the amount of historical daily data included.
StartHour can be aligned with the broker server time.
MT4 Indicator Parameters
The table below lists the available MT4 indicator parameters. You can customize these options in the MetaTrader Inputs dialog to match your trading preferences.
| Parameter | Description |
|---|---|
| StartHour | Sets the daily start hour used for the calculation. |
| Days_Ago | Sets how many prior days are examined. |
| ColorCurrentDay | Sets the current-day line color. |
| ColorNextDay | Sets the next-day or historical line color. |
| LineWidth | Sets the horizontal-line width. |
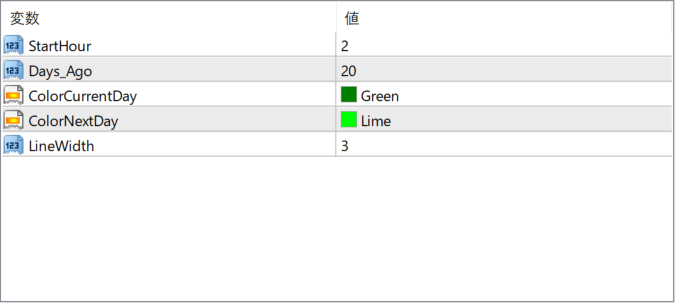
The screenshot above shows the default input parameters in the MT4 settings window.
How to Install .ex4 Indicator in MetaTrader 4
- Download the ZIP file and extract it.
- In MT4, select File → Open Data Folder.
- Open MQL4 → Indicators and copy the EX4 or MQ4 file into it.
- If the package includes library files, copy them to MQL4 → Libraries. Copy TPL files to the top-level templates folder.
- Restart MT4, find the indicator in the Navigator, and drag it onto a chart.
Test the tool on a demo account first. File contents and required folders can vary between packages.


