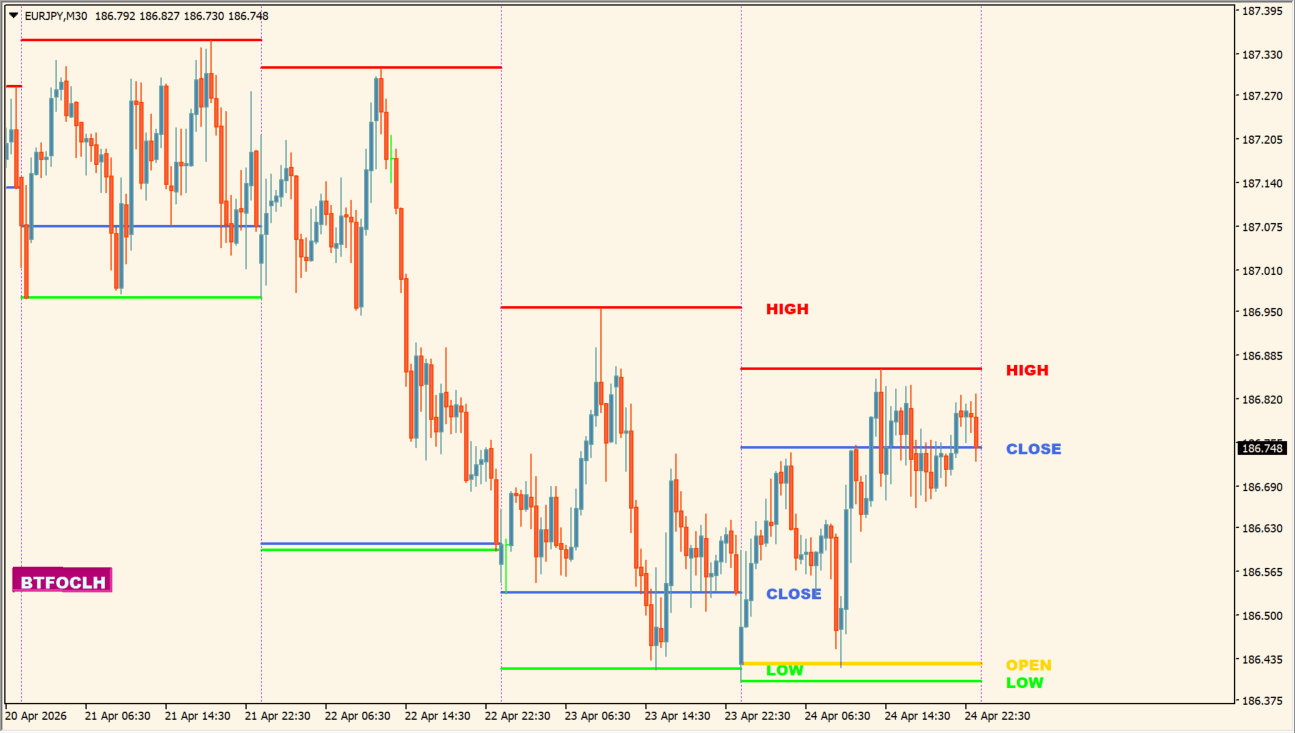
What is Bigger TF OCLH dvl w Arrows?
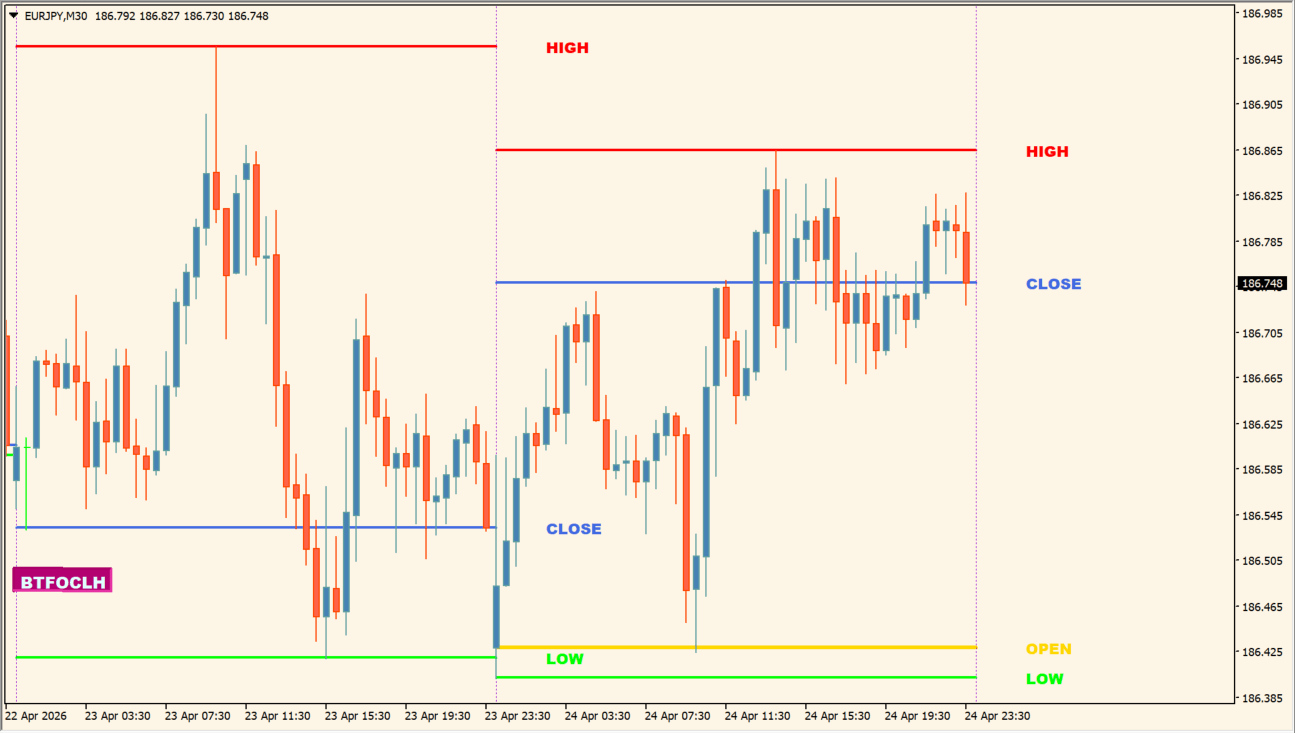
Bigger TF OCLH displays the open, close, low, and high of a selected higher timeframe as horizontal references on an MT4 chart. Different colors separate the four price fields.
The indicator can show labels and optional arrows while keeping the higher-timeframe references on the active chart. The package includes an .mq4 file.
How to use Bigger TF OCLH dvl w Arrows
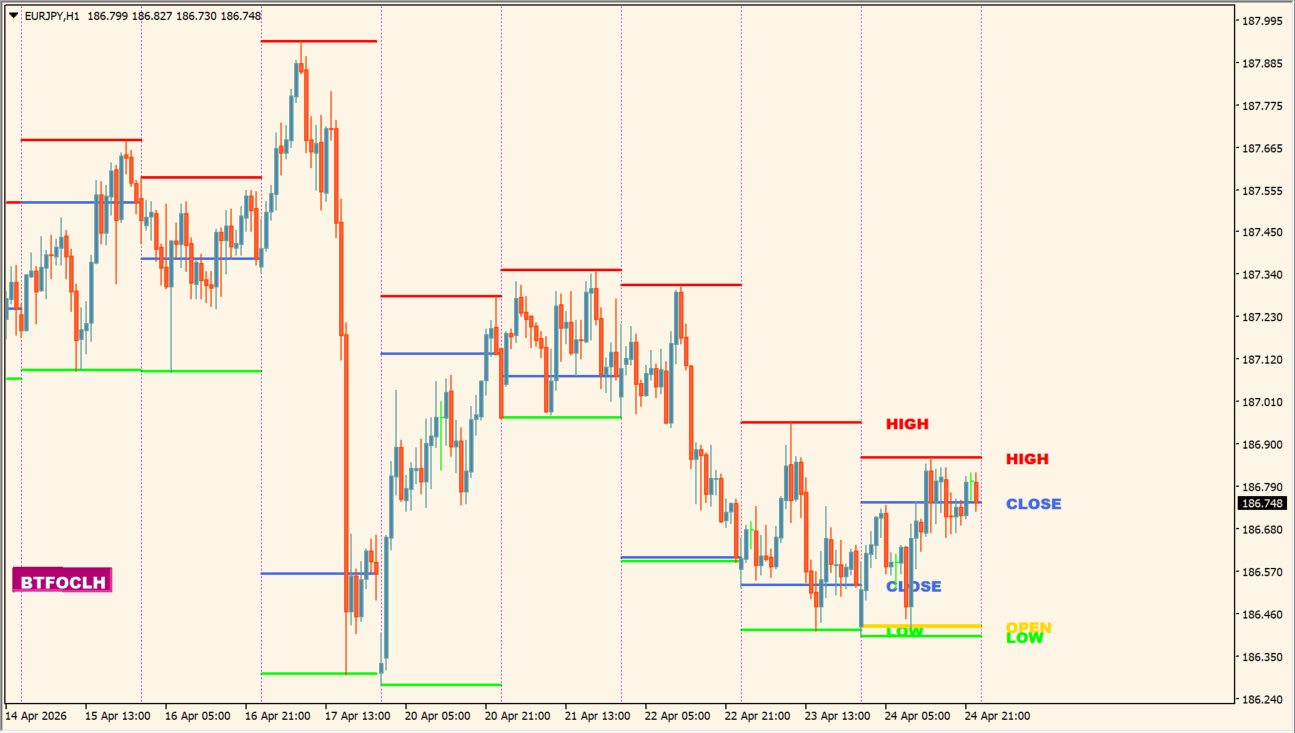
Compare the higher-timeframe O/H/L/C lines with the current candles and nearby chart structure. A daily view on a lower timeframe provides a compact way to review the broader session range.
CountTF, TimeFrame, Method, LinesPlusTF, and the ShowOpen, ShowClose, ShowLow, and ShowHigh options control the reference set. Color, label, arrow, button, and alert settings control presentation.
Where it helps
Open, high, low, and close remain visible in one overlay.
Higher-timeframe values can be compared with lower-timeframe candles.
Line, label, arrow, button, and alert options are configurable.
MT4 Indicator Parameters
The table below lists the available MT4 indicator parameters. You can customize these options in the MetaTrader Inputs dialog to match your trading preferences.
| Parameter | Description |
|---|---|
| CountTF | Sets the amount of higher-timeframe history displayed. Default: 21. |
| TimeFrame | Selects the higher timeframe used for the O/H/L/C values. Default: 1 Day. |
| Method | Selects the calculation method for the displayed references. Default: Current. |
| LinesPlusTF | Sets the additional timeframe line count. Default: 0. |
| ShowOpen | Controls the open-line display. Default: only Current. |
| ShowClose | Controls the close-line display. Default: all Lines. |
| ShowLow | Controls the low-line display. Default: all Lines. |
| ShowHigh | Controls the high-line display. Default: all Lines. |
| OpenColor | Sets the open-line color. Default: Gold. |
| CloseColor | Sets the close-line color. Default: RoyalBlue. |
| LowColor | Sets the low-line color. Default: Lime. |
| HighColor | Sets the high-line color. Default: Red. |
| Separator | Sets the separator color. Default: DarkViolet. |
| LinesStyle | Sets the line style. Default: Solid. |
| LinesWidth | Sets the line width. Default: 2. |
| ShowLabels | Shows or hides line labels. Default: true. |
| TextSize | Sets the label text size. Default: 9. |
| ShowArrows | Selects the arrow display mode. Default: Hide Arrows. |
| ARROWBAR | Sets the arrow bar offset. Default: 0. |
| ArrowGap | Sets the arrow gap. Default: 7.0. |
| ColorBUY | Sets the up-arrow color. Default: LightCyan. |
| ColorSELL | Sets the down-arrow color. Default: Magenta. |
| CodeBUY | Sets the up-arrow code. Default: 233. |
| CodeSELL | Sets the down-arrow code. Default: 234. |
| ArrowSize | Sets the arrow size. Default: 1. |
| SoundFile | Sets the alert sound file. Default: alert2.wav. |
| ALERTBAR | Sets the alert bar offset. Default: 1. |
| AlertsMessage | Enables message alerts. Default: true. |
| AlertsSound | Enables sound alerts. Default: true. |
| AlertsEmail | Enables email alerts. Default: false. |
| AlertsMobile | Enables mobile alerts. Default: false. |
| buttColor | Sets the button text color. Default: LightCyan. |
| buttSize | Sets the button text size. Default: 10. |
| backColor | Sets the button background color. Default: MediumVioletRed. |
| axisX | Sets the button horizontal axis position. Default: 0. |
| axisY | Sets the button vertical axis position. Default: 444. |
| buttCorner | Selects the button base corner. Default: Left upper chart corner. |
| buttWindow | Sets the button window. Default: 0. |
| buttName | Sets the button text. Default: BTFOCLH. |
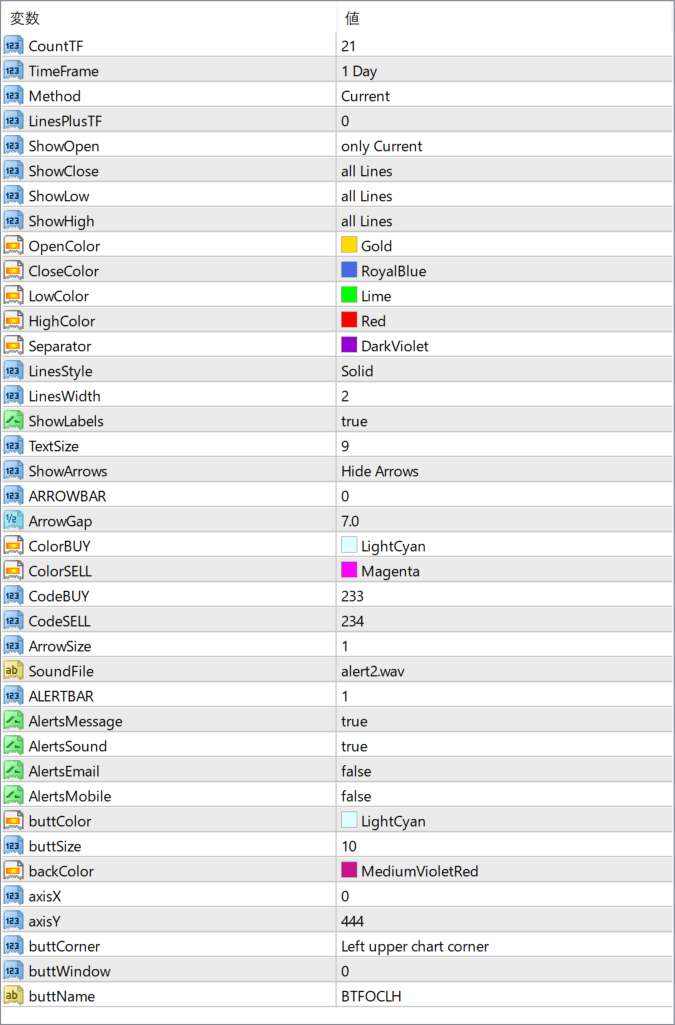
The screenshot above shows the default input parameters in the MT4 settings window.
How to Install .ex4 Indicator in MetaTrader 4
- Download the ZIP file and extract it.
- In MT4, select File → Open Data Folder.
- Open MQL4 → Indicators and copy the EX4 or MQ4 file into it.
- If the package includes library files, copy them to MQL4 → Libraries. Copy TPL files to the top-level templates folder.
- Restart MT4, find the indicator in the Navigator, and drag it onto a chart.
Test the tool on a demo account first. File contents and required folders can vary between packages.


