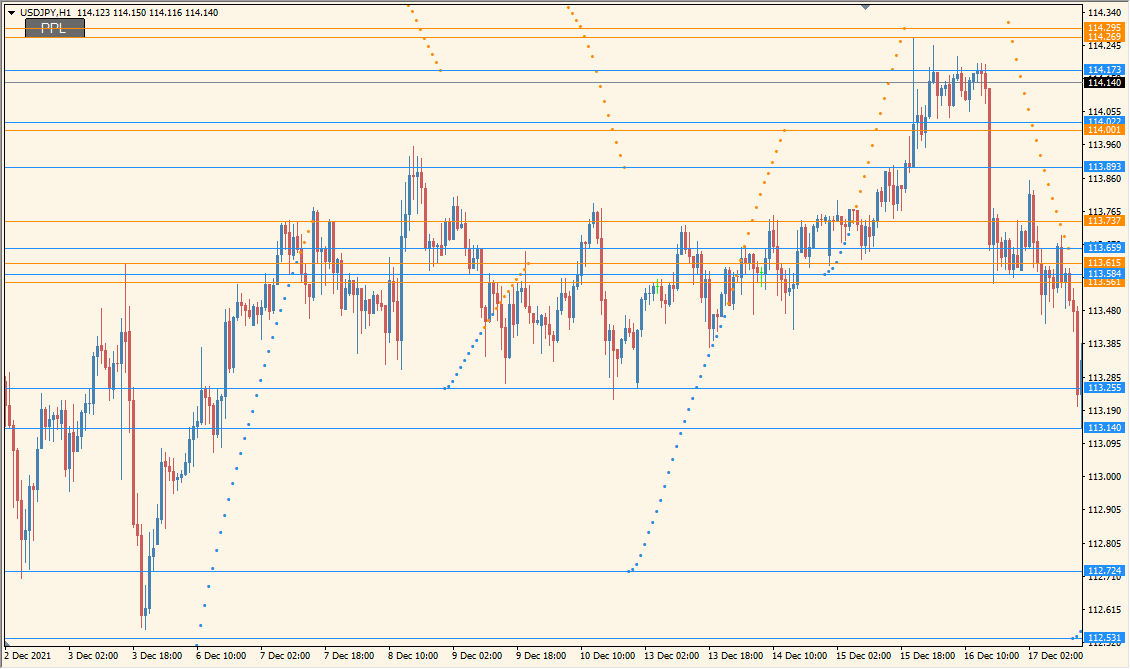
What is Brooky_Psar_Levels_SR_V3 Indicator?
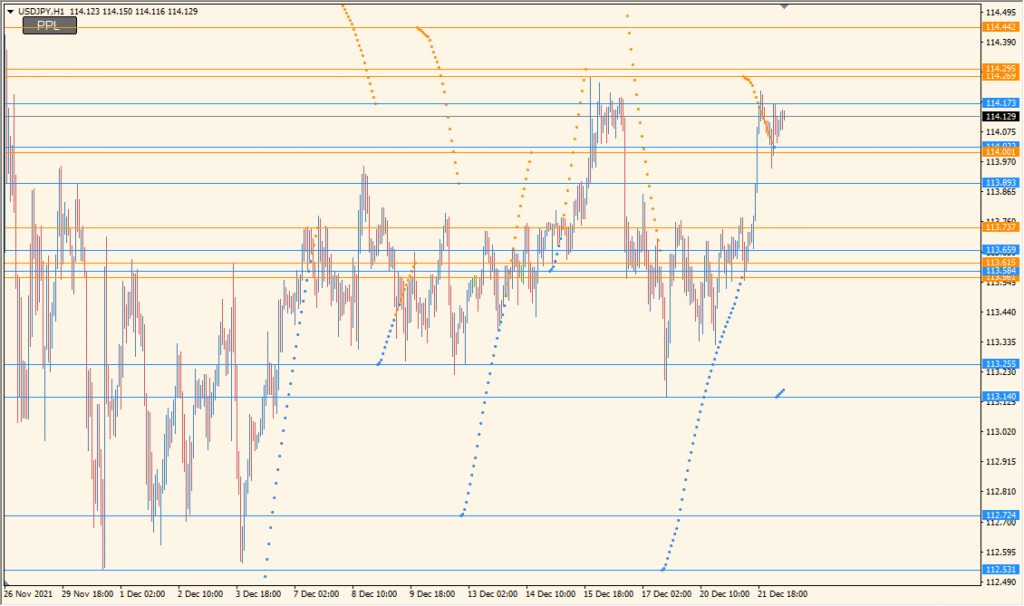
Brooky PSAR Levels SR V3 for MT4 combines Parabolic SAR dots with swing-based support and resistance levels. The levels can be calculated from a selected timeframe and displayed on the active chart.
bars_back, TimeF, sar_step, and sar_max control the historical scan, source timeframe, and PSAR response. The combined display provides a compact way to compare dynamic dots with broader price levels.
How to Use It in Practice
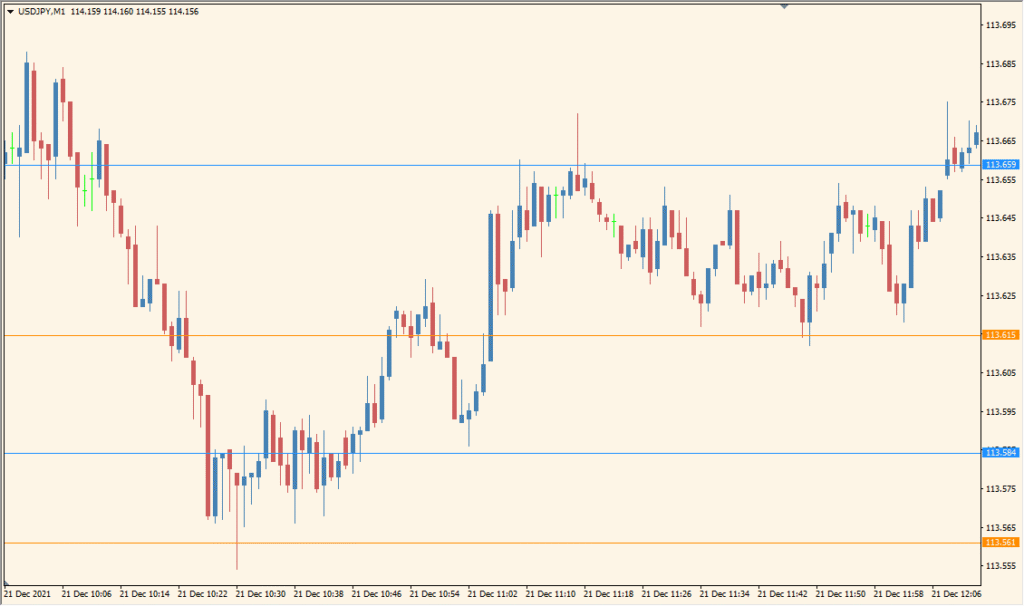
Locate the first Parabolic SAR dot after a displayed switch, because the horizontal level is drawn from that dot. Short calculation timeframes create many lines; the view is more readable from H4 or above, where the PSAR-derived levels can be compared with the active chart without crowding it.
- Find the initial PSAR dot at each displayed switch and trace the corresponding horizontal level across the chart.
- Choose the source timeframe with TimeF and adjust bars_back; use a broader source timeframe when the lower-timeframe lines become too dense.
- Set sar_step and sar_max to inspect a different PSAR response.
- Compare the retained levels with current price movement and the surrounding high-low structure.
PSAR and support/resistance references share one chart, the source timeframe is configurable, and the core level and PSAR settings are easy to adjust.
MT4 Indicator Parameters
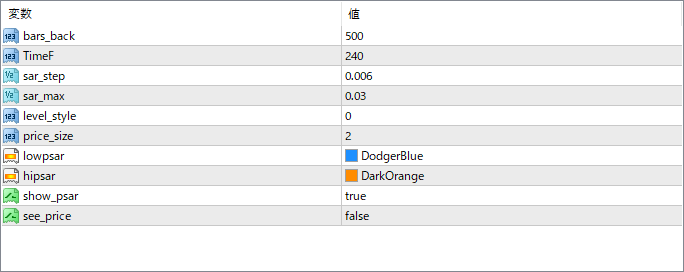
The screenshot above shows the default input parameters in the MT4 settings window.
| Parameter | Description |
|---|---|
| bars_back | Sets how many candles back the indicator will look to calculate swing levels and PSAR data. |
| TimeF | Specifies the timeframe (in minutes) from which to derive the swing levels. Allows multi-timeframe analysis on a lower chart. |
| sar_step | Acceleration factor step for PSAR. Controls how quickly the SAR follows the price. |
| sar_max | Maximum value the PSAR can reach as it trails the price. Affects the sensitivity of SAR to price movement. |
| level_style | Determines how the support/resistance levels are displayed visually on the chart (e.g., dotted, solid lines). |
| price_size | Adjusts the size of the price label if it’s displayed on the chart. |
| lowpsar | Defines the color of the PSAR dots plotted below the candles (uptrend indication). |
| hipsar | Defines the color of the PSAR dots plotted above the candles (downtrend indication). |
| show_psar | If set to true, PSAR dots will be displayed. Set to false to hide them and only show the levels. |
| see_price | Controls whether the price value is shown on the support/resistance levels. |


