What is Brooky_Psar_Levels_SR_V3 Indicator?
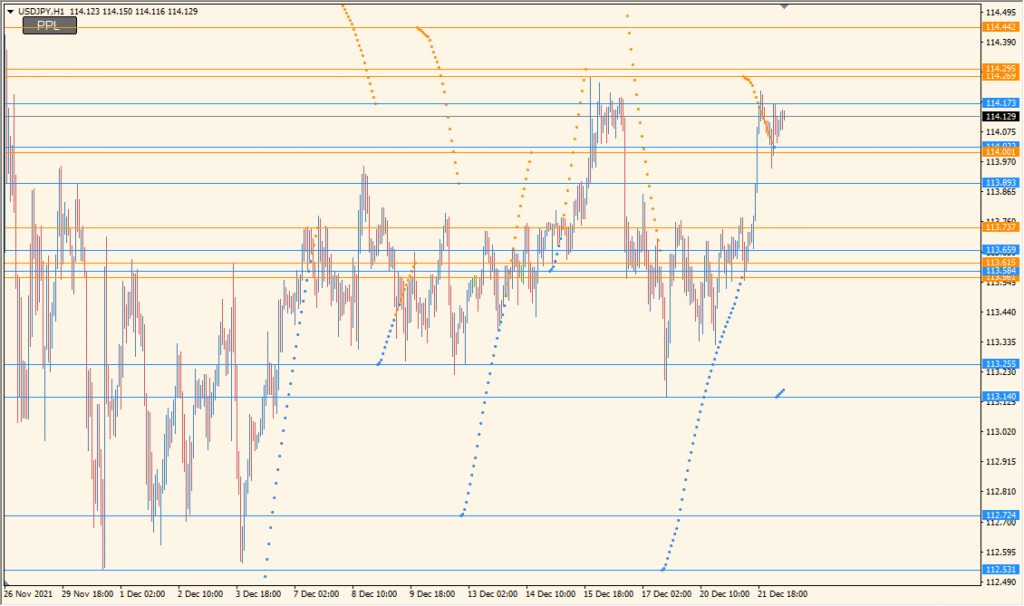
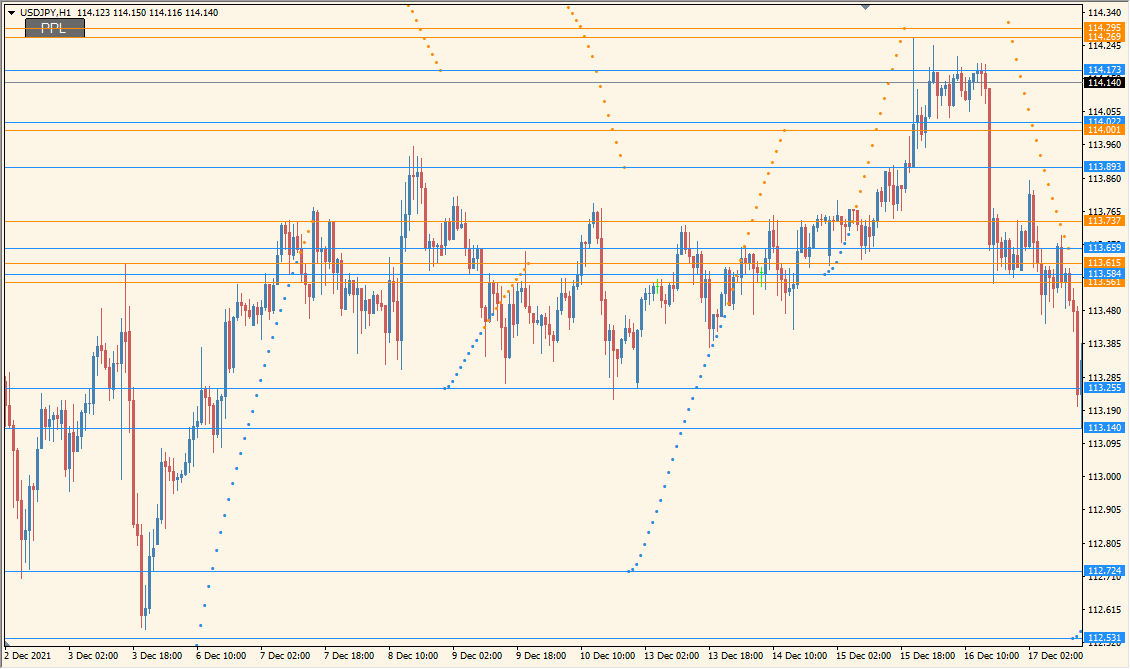
The Brooky_Psar_Levels_SR_V3 indicator for MT4 combines Parabolic SAR logic with support and resistance level plotting. It calculates swing highs and lows using a separate timeframe and overlays PSAR dots to provide clearer market structure. This dual-layer approach helps traders spot potential trend shifts and key zones of interest with higher confidence.
It is particularly useful for those who like to blend dynamic support/resistance with trend-following indicators such as PSAR, all without overloading the chart.
How to Use It in Practice
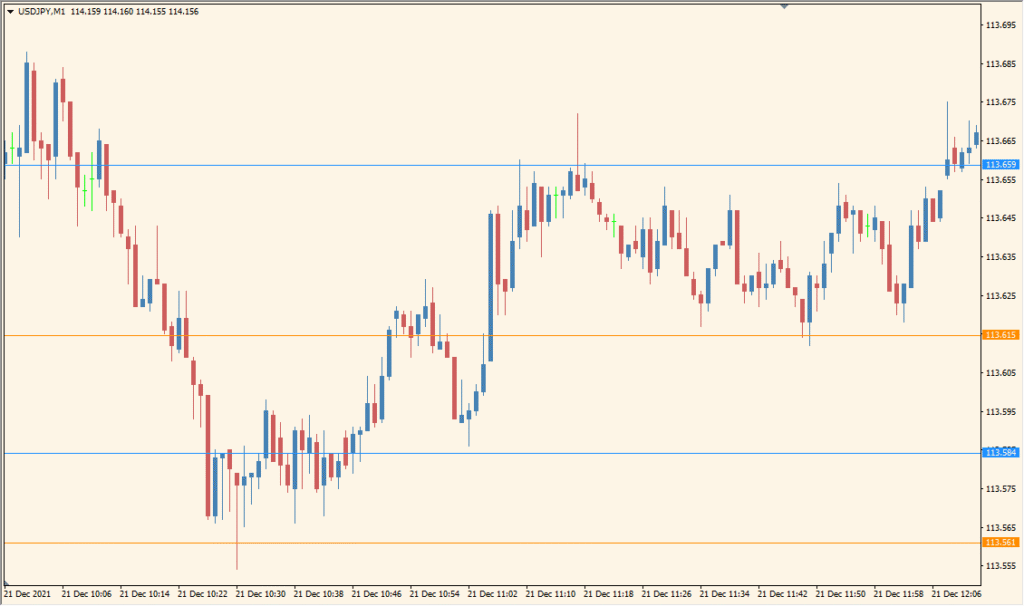
In a trading setup, you can use this indicator to:
- Identify potential reversal zones using plotted PSAR-based support/resistance levels.
- Confirm ongoing trends with the Parabolic SAR dots.
- Filter entries by combining level confluence and PSAR direction.
- Use higher timeframe levels for more reliable signals on lower timeframes.
It works well for both breakout and reversal strategies, especially when used with price action or other confirmation tools.
Best Settings & MT4 Parameters for Brooky_Psar_Levels_SR_V3
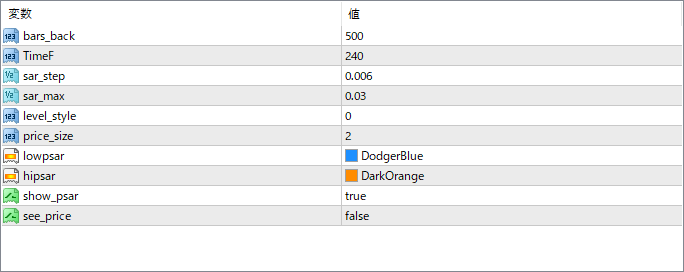
bars_back
Sets how many candles back the indicator will look to calculate swing levels and PSAR data.
TimeF
Specifies the timeframe (in minutes) from which to derive the swing levels. Allows multi-timeframe analysis on a lower chart.
sar_step
Acceleration factor step for PSAR. Controls how quickly the SAR follows the price.
sar_max
Maximum value the PSAR can reach as it trails the price. Affects the sensitivity of SAR to price movement.
level_style
Determines how the support/resistance levels are displayed visually on the chart (e.g., dotted, solid lines).
price_size
Adjusts the size of the price label if it’s displayed on the chart.
lowpsar
Defines the color of the PSAR dots plotted below the candles (uptrend indication).
hipsar
Defines the color of the PSAR dots plotted above the candles (downtrend indication).
show_psar
If set to true, PSAR dots will be displayed. Set to false to hide them and only show the levels.
see_price
Controls whether the price value is shown on the support/resistance levels.