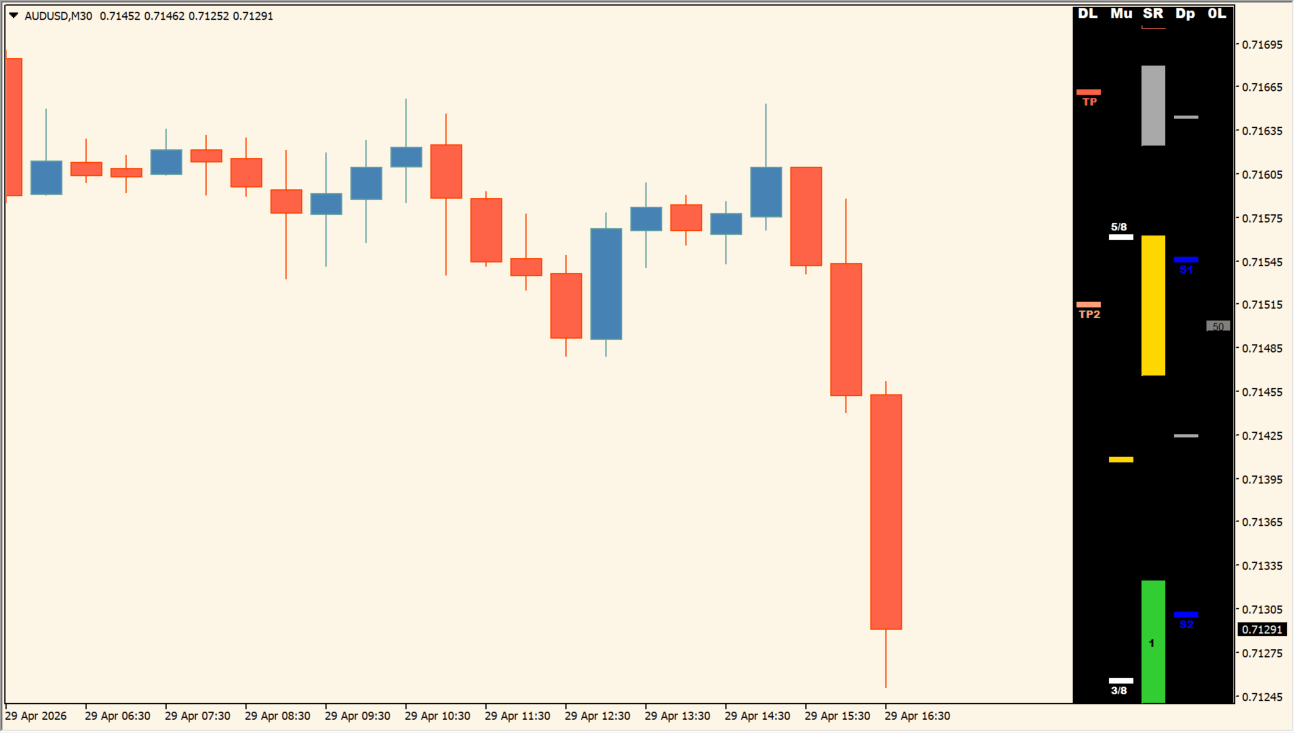
What is Buy Sell Levels Indicator?
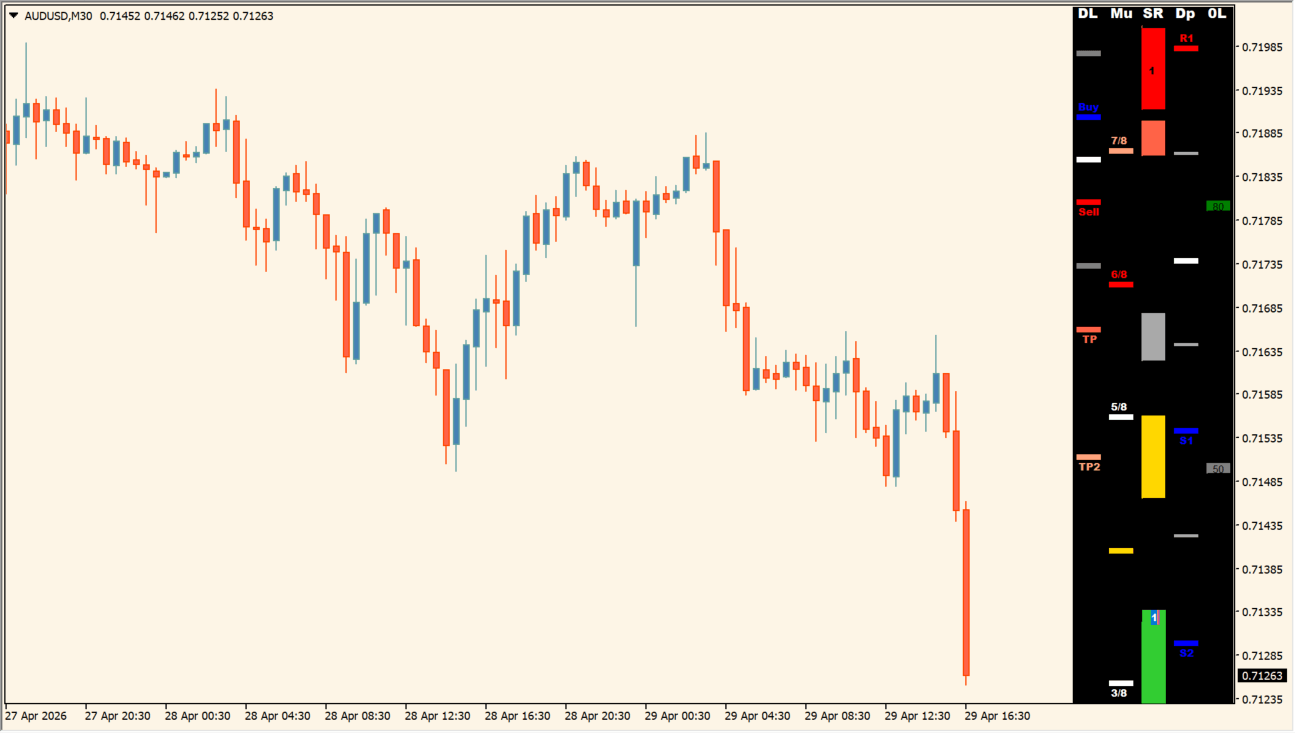
Buy Sell Levels Indicator displays a vertical panel on the chart’s right side. The panel combines daily levels, pivots, Murrey Math levels, round-number levels, and price references so that several calculated price areas can be compared at once.
The panel uses separate columns and colors for its components. It is therefore possible to keep the contributing level types visible without manually drawing each group.
How to use Buy Sell Levels Indicator
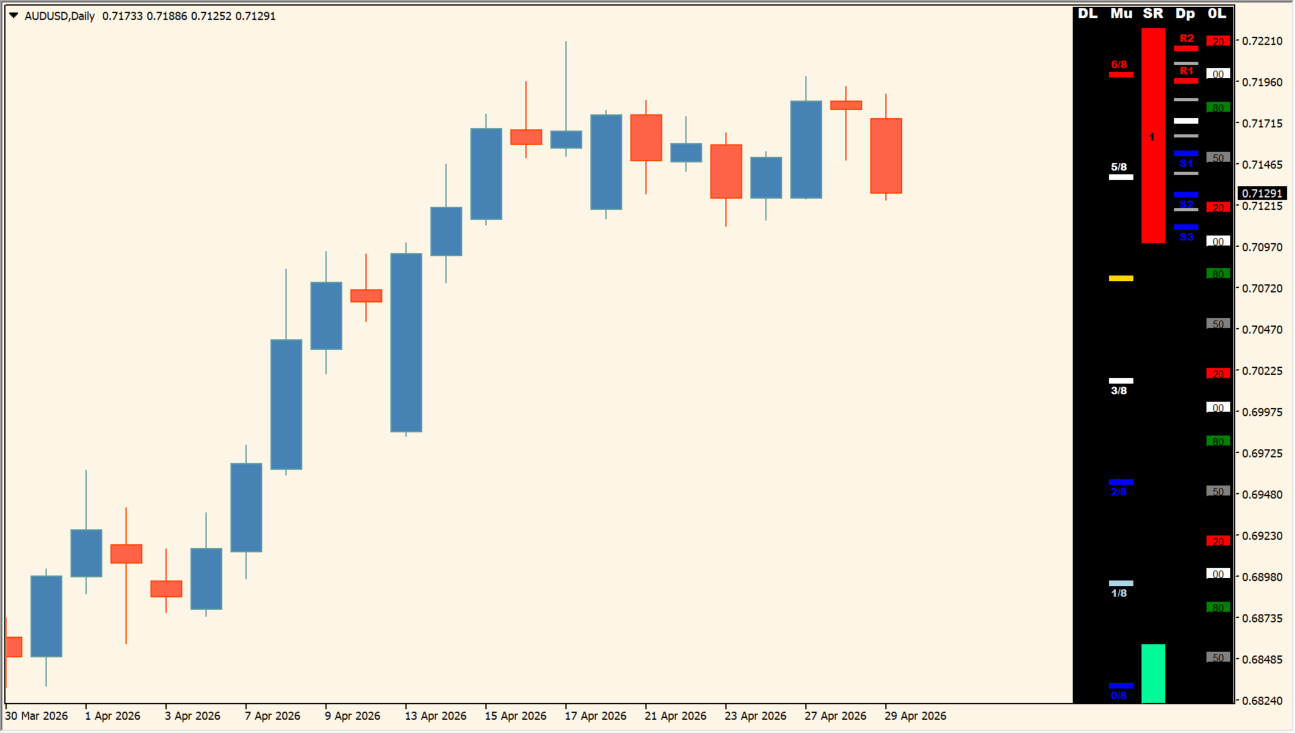
Read the right-side panel as a set of displayed level groups: daily levels, Murrey Math levels, support and resistance references, pivots, and round-number levels. Compare areas where more than one group is displayed near the same price with the surrounding chart context.
Column 1 through Column 5 control the panel columns, GMT Shift changes the time offset, and Mid pivots, P, MMPeriod, Back Limit, Time Frame, and the fractal inputs change the calculation. The Show level and color inputs change the round-number references and their appearance.
Where it helps
Daily, pivot, Murrey Math, and round-number references are displayed together.
Five column inputs control the right-side panel layout.
Separate level and color Inputs control the round-number references.
MT4 Indicator Parameters
The table below lists the available MT4 indicator parameters. You can customize these options in the MetaTrader Inputs dialog to match your trading preferences.
| Parameter | Description |
|---|---|
| * | RED Levels Bar section. |
| ============================== | Settings section. |
| Shift X | Sets the horizontal panel shift. |
| ============================== | Settings section. |
| Column 1 | Controls the first panel column. |
| Column 2 | Controls the second panel column. |
| Column 3 | Controls the third panel column. |
| Column 4 | Controls the fourth panel column. |
| Column 5 | Controls the fifth panel column. |
| ============================== | Settings section. |
| * | RED D-Levels section. |
| GMT Shift | Sets the GMT time offset. |
| ============================== | Settings section. |
| * | Pivot settings section. |
| Mid pivots | Controls the mid-pivot display. |
| ============================== | Settings section. |
| * | Murrey settings section. |
| P | Controls the pivot setting. |
| MMPeriod | Sets the Murrey Math period. |
| Color Theme | Selects the panel color theme. |
| ============================== | Settings section. |
| * | Support and resistance settings section. |
| Back Limit | Sets the calculation-history limit. |
| Time Frame | Sets the timeframe used by the calculation. |
| Zone fuzzfactor | Sets the zone tolerance factor. |
| fractal_fast_factor | Sets the fast fractal factor. |
| fractal_slow_factor | Sets the slow fractal factor. |
| ============================== | Settings section. |
| * | Key levels settings section. |
| Show 00 Levels | Shows or hides 00 levels. |
| Show 50 Levels | Shows or hides 50 levels. |
| Show 20 80 Levels | Shows or hides 20 and 80 levels. |
| Level 00 Color | Sets the 00-level color. |
| Level 50 Color | Sets the 50-level color. |
| Level 20 Color | Sets the 20-level color. |
| Level 80 Color | Sets the 80-level color. |
| ============================== | Settings section. |
| Price Line Color | Sets the price-line color. |
| ============================== | Settings section. |
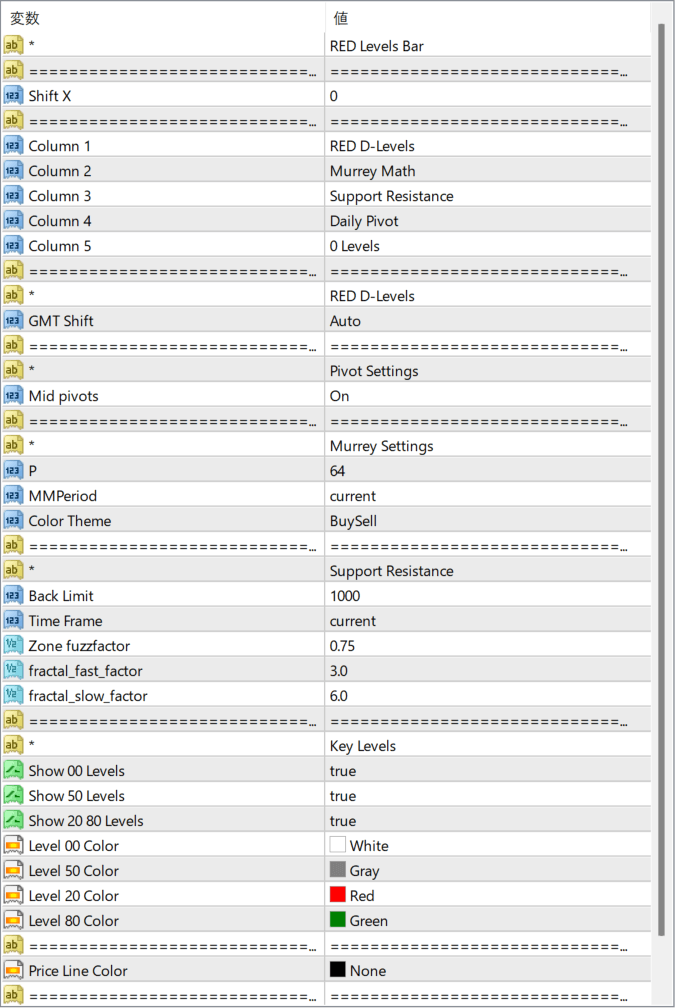
The screenshot above shows the default input parameters in the MT4 settings window.
How to Install .ex4 Indicator in MetaTrader 4
- Download the ZIP file and extract it.
- In MT4, select File → Open Data Folder.
- Open MQL4 → Indicators and copy the EX4 or MQ4 file into it.
- If the package includes library files, copy them to MQL4 → Libraries. Copy TPL files to the top-level templates folder.
- Restart MT4, find the indicator in the Navigator, and drag it onto a chart.
Test the tool on a demo account first. File contents and required folders can vary between packages.


