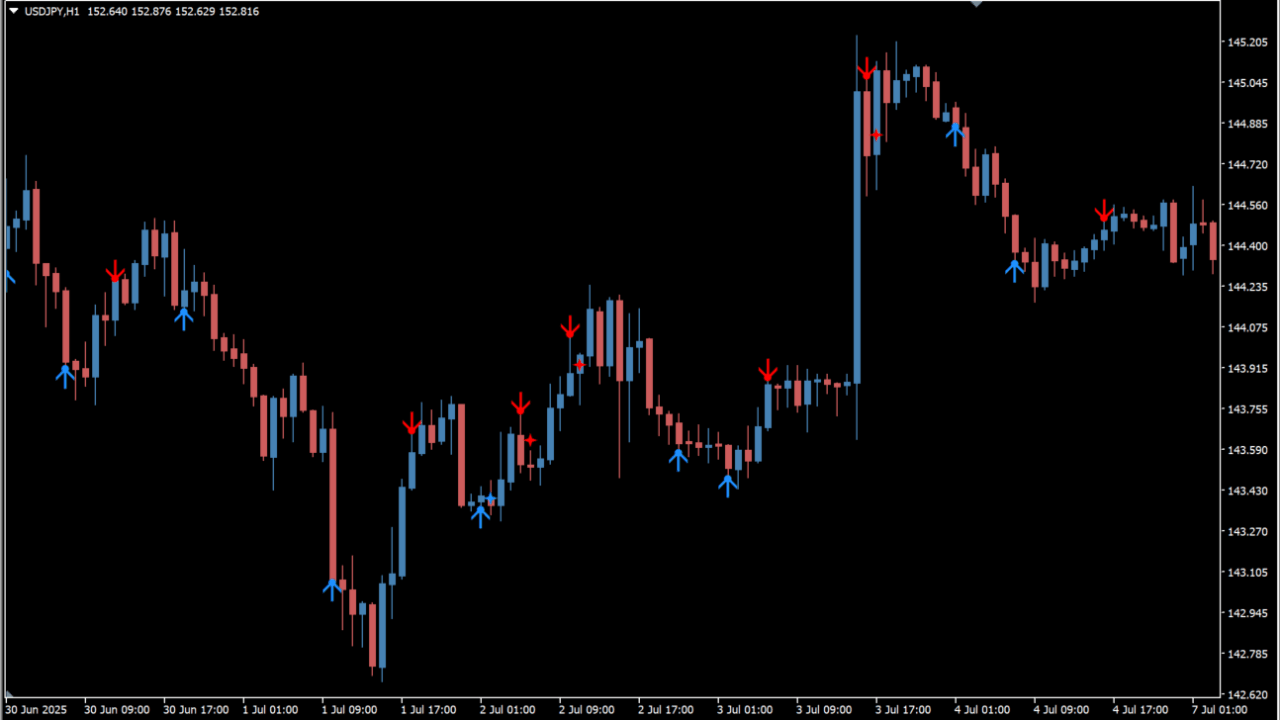
What is BuySellPivots?
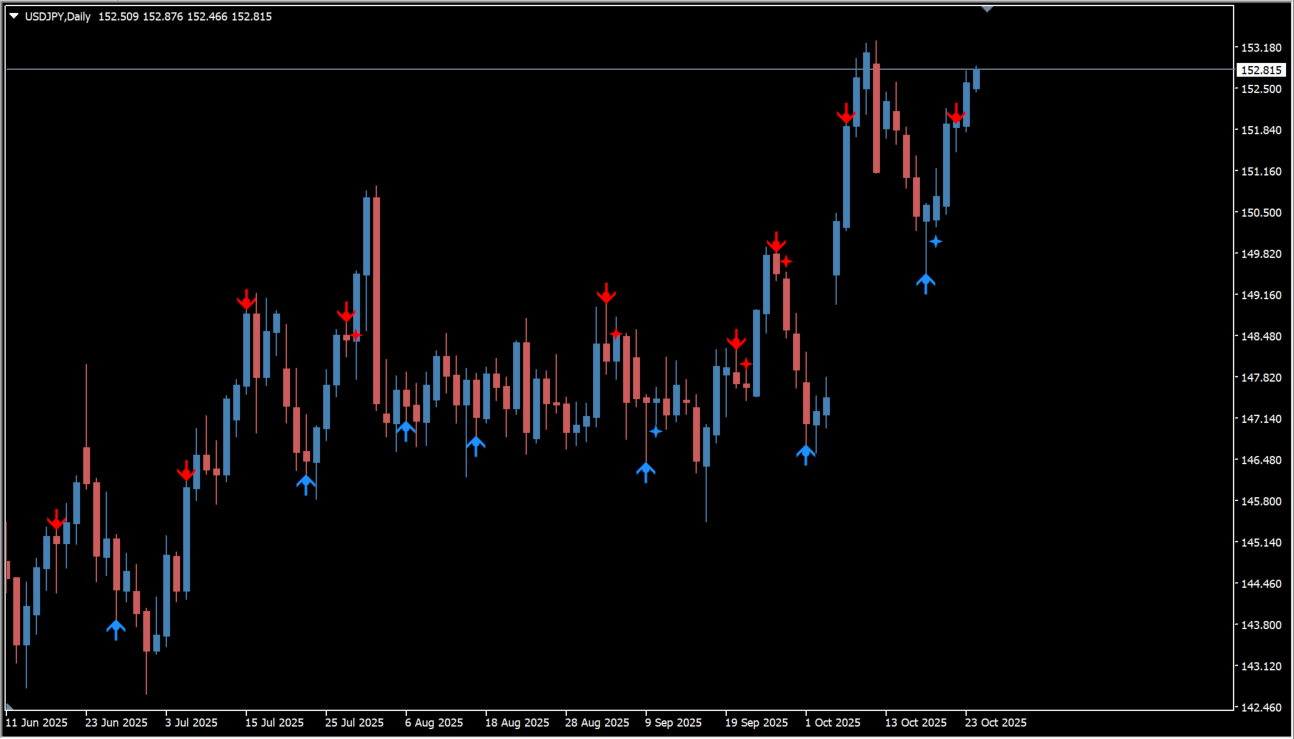
BuySellPivots is an MT4 indicator that detects possible reversal points from recent highs and lows and marks them with colored arrows. Blue arrows indicate upward reversals, red arrows indicate downward reversals, and crosses mark retracement touches.
How to use BuySellPivots
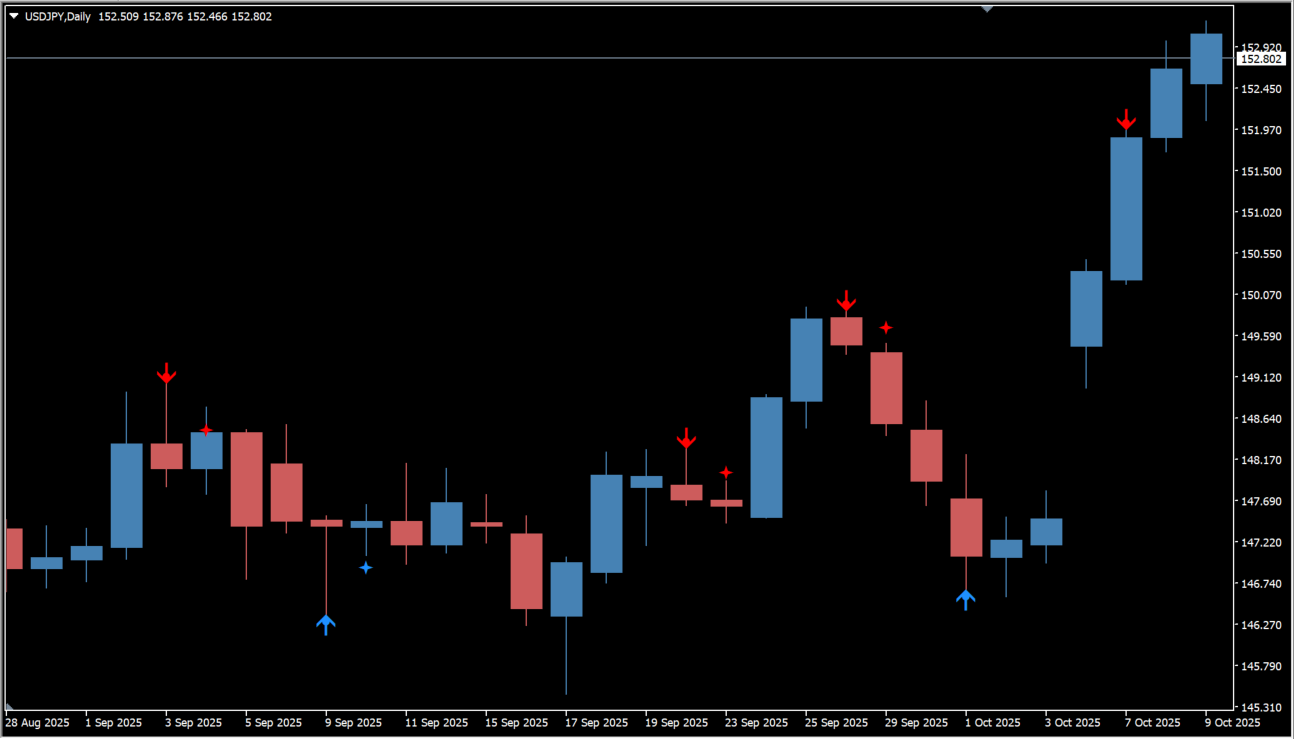
Four reversal marker categories appear when price updates a recent high or low, turns, or touches a retracement line. Compare a marker with the surrounding candles and with the most recent high or low on the same chart.
Where it helps
MT4 Indicator Parameters
The table below lists the available MT4 indicator parameters. You can customize these options in the MetaTrader Inputs dialog to match your trading preferences.
| Parameter | Description |
|---|---|
| Show Retracement Level | Shows or hides retracement levels on the chart. Default: true. |
| Arrow Pip Buffer | Sets the pip spacing between arrows and candles. Default: 3.0. |
| ALERTS | Configuration group. |
| Pivot Signal Alert | Enables or disables alerts for new pivot signals. Default: true. |
| Retracement Touch Alert | Enables or disables alerts when price touches a retracement level. Default: true. |
| ALERT_TYPES | Configuration group. |
| Chart Pop-up Alert | Shows or hides chart pop-up notifications when a signal occurs. Default: true. |
| Audible Alert (Leave blank for no sound) | Sets the alert sound filename; blank disables sound. Default: alert.wav. |
| E-mail Alert | Enables or disables email notifications. Default: false. |
| Mobile Alert | Enables or disables mobile push notifications. Default: false. |
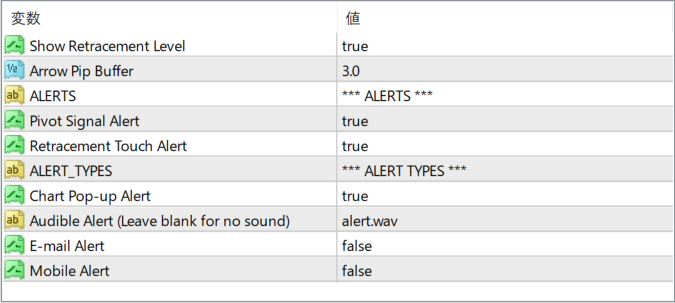
The screenshot above shows the default input parameters in the MT4 settings window.
How to Install .ex4 Indicator in MetaTrader 4
- Download the ZIP file and extract it.
- In MT4, select File → Open Data Folder.
- Open MQL4 → Indicators and copy the EX4 or MQ4 file into it.
- If the package includes library files, copy them to MQL4 → Libraries. Copy TPL files to the top-level templates folder.
- Restart MT4, find the indicator in the Navigator, and drag it onto a chart.
Test the tool on a demo account first. File contents and required folders can vary between packages.


