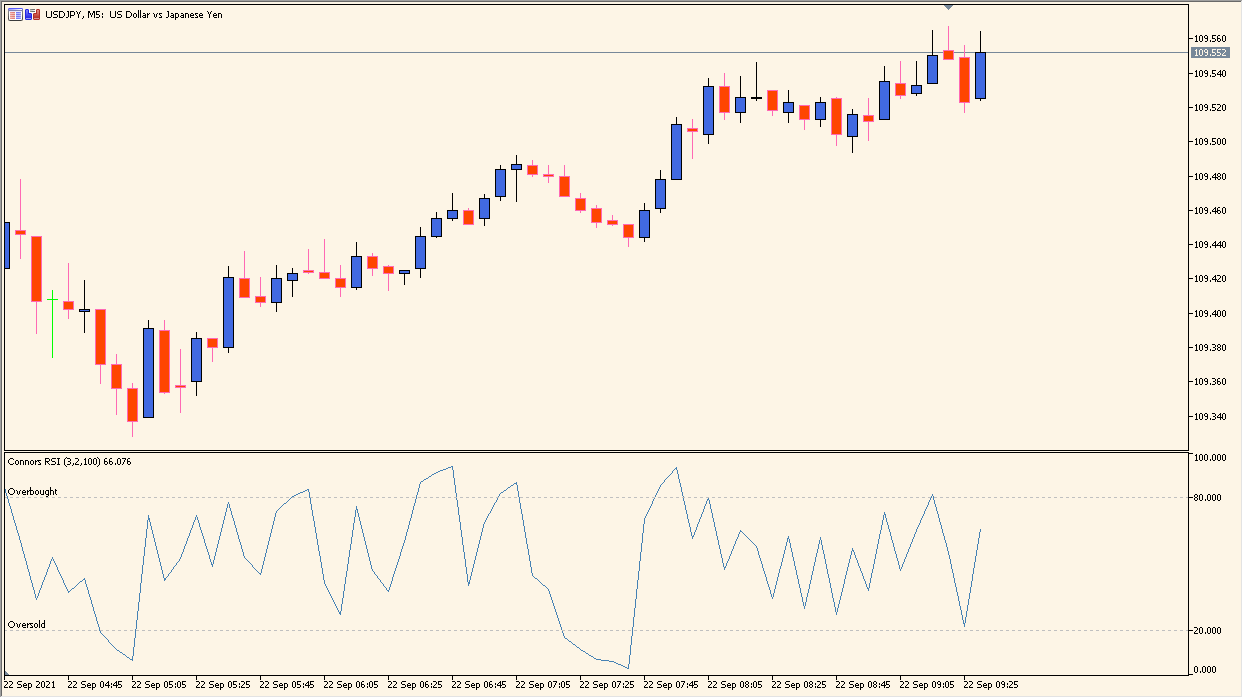
What is Connors RSI Indicator?
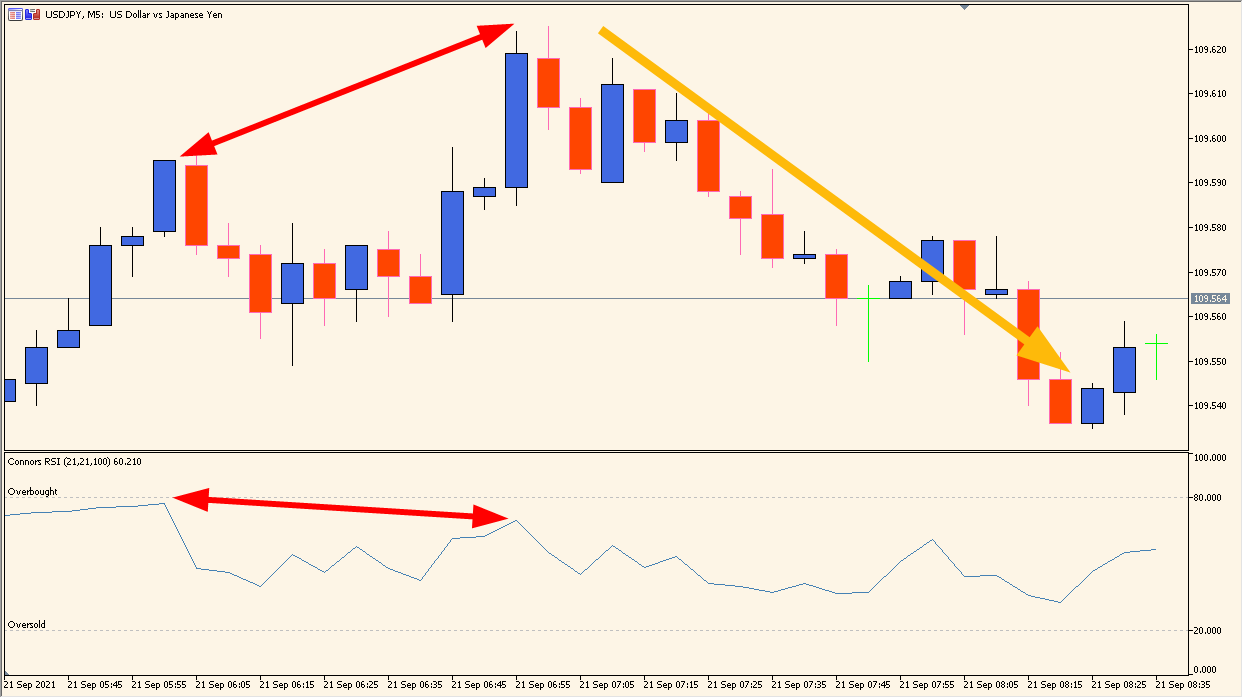
The Connors RSI indicator combines a short-term RSI, a streak-based momentum measure, and a percentile ranking of recent price changes. Bringing these components together provides one oscillator view for reviewing short-term price behavior.
The overbought and oversold levels act as visual reference points. Compare the oscillator with recent price action and chart structure rather than treating one reading as a standalone decision.
How to Use It in Practice
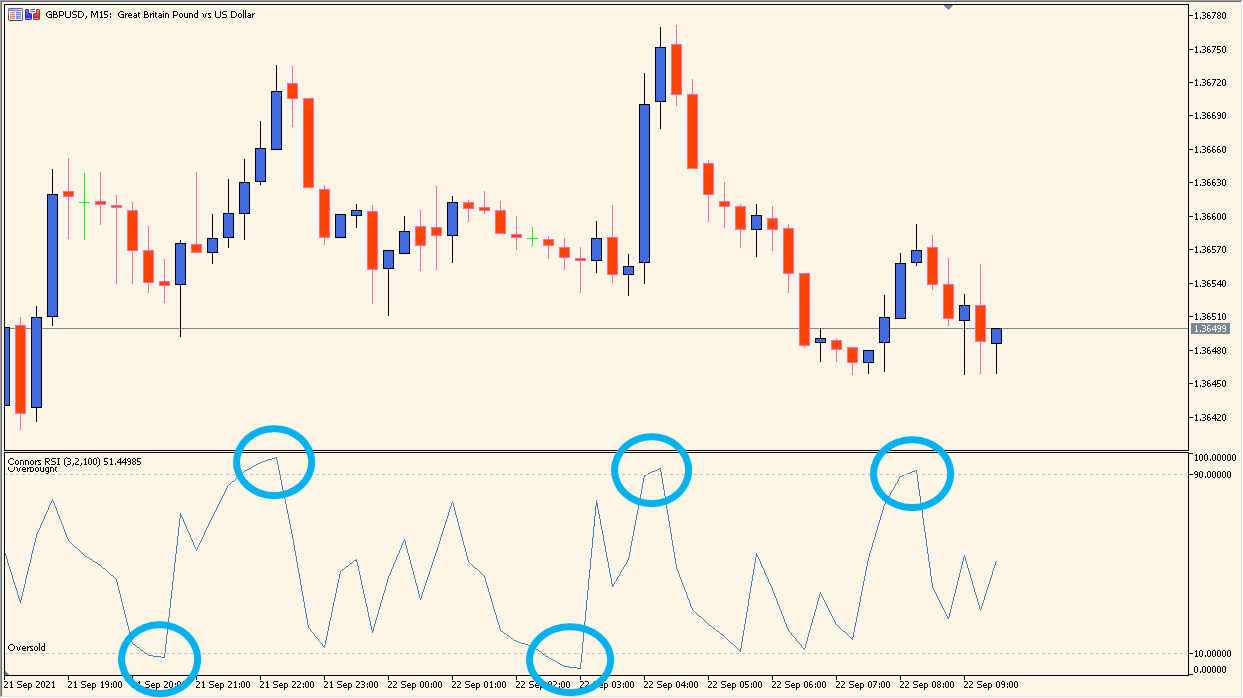
Read the composite pane as a short-period RSI combined with a count of consecutive rises or falls and a rate-of-change component. Its default short period makes the display responsive, so compare its swings with the candles and use the levels to make the amount of displayed activity manageable.
- Review the composite swing together with recent price movement, including any visible divergence rather than relying on one reading.
- Use RSI period, Pulse RCI period, and Percent rank period to inspect a slower or faster composite response.
- Set Applied price and the Overbought or Oversold levels to control the displayed reference range; a 90/10 range reduces the number of highlighted extremes.
- Treat the pane as short-term price-behavior context and retain the surrounding chart structure in the comparison.
Three complementary RSI-related components appear in one oscillator, threshold levels provide visual structure, and the existing Inputs allow the display to be reviewed with different settings.
MT5 Indicator Parameters
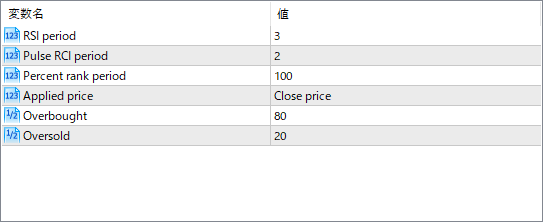
The screenshot above shows the default input parameters in the MT5 settings window.
| Parameter | Description |
|---|---|
| RSI period | Defines the lookback period for the short-term RSI component, affecting its sensitivity to price changes. |
| Pulse RCI period | Specifies the streak length calculation, measuring consecutive up or down closes to capture short-term momentum shifts. |
| Percent rank period | Determines the number of bars used to rank today’s price change relative to recent history, adding a comparative strength element. |
| Applied price | Sets which price type (e.g., close, open, high, low) is used in the calculations. |
| Overbought | Defines the upper threshold level where the market may be considered overbought and due for a correction. |
| Oversold | Defines the lower threshold level where the market may be considered oversold and due for a bounce. |


