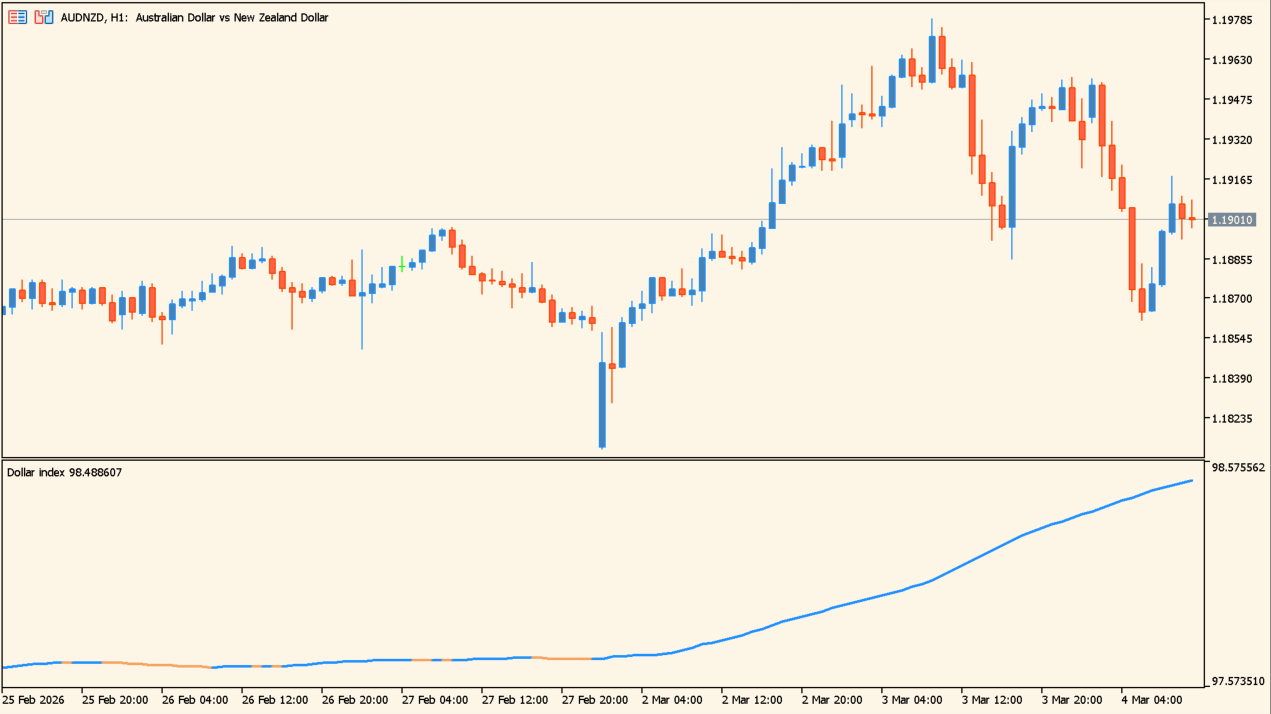
What is Dollar index?
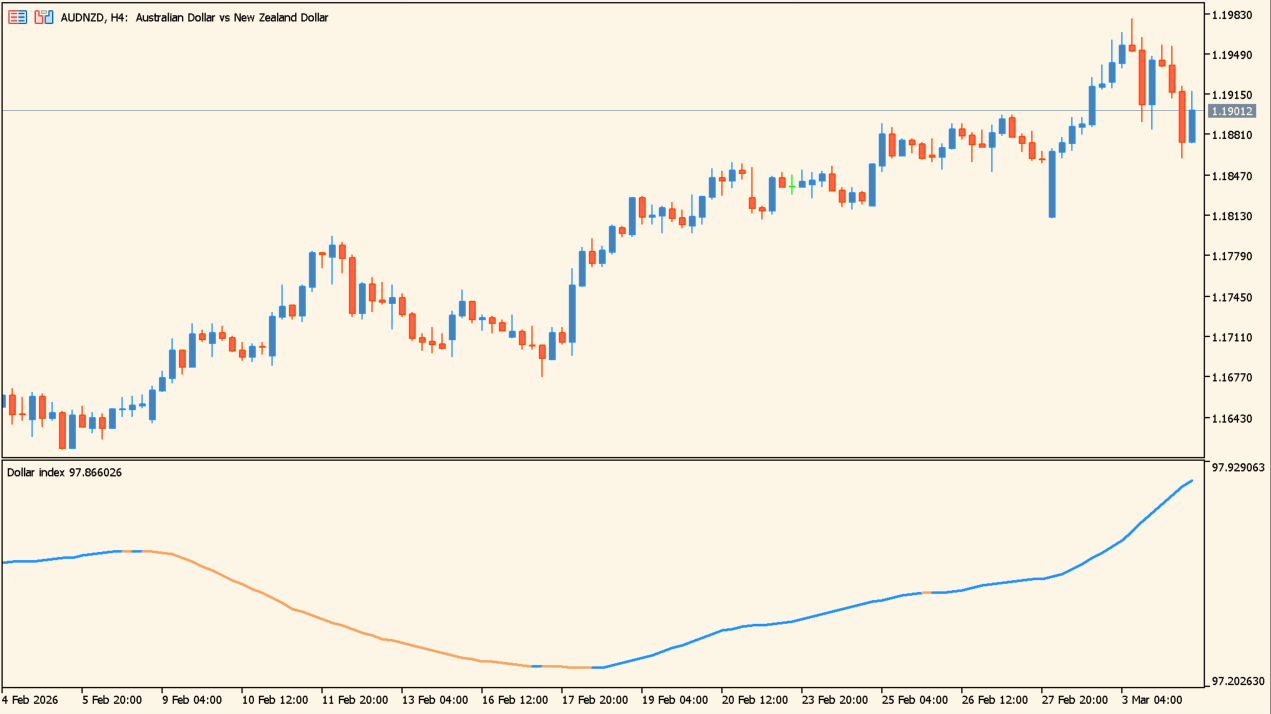
Dollar index calculates a composite USD measure from EURUSD, USDJPY, GBPUSD, USDCAD, USDSEK, and USDCHF, then displays a moving-average version in a subwindow. The line is intended to show the strength of the dollar itself rather than the direction of one pair.
A rising line represents stronger dollar pressure in the displayed context, while a falling line represents weaker pressure. Smoothing reduces some noise so the broader background can be compared with an individual USD pair.
How to use Dollar index
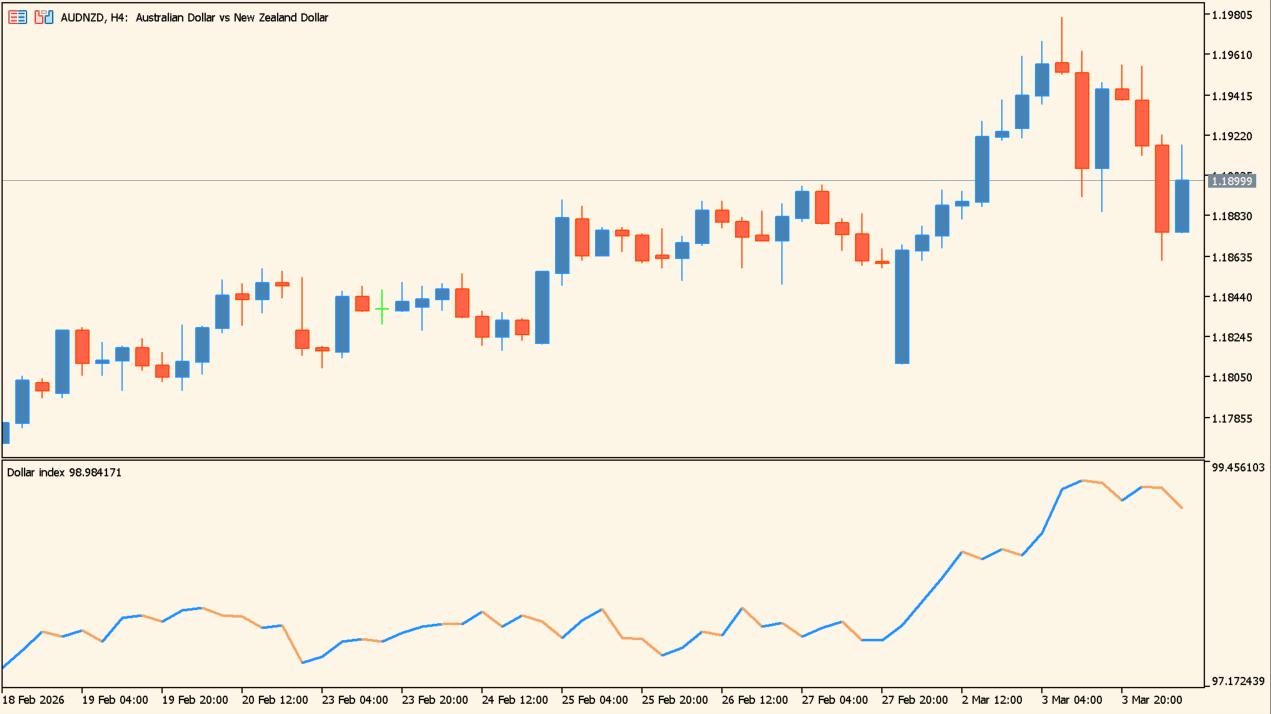
Apply Dollar index to an MT5 chart and compare the smoothed USD line with the pair you are studying instead of reading the pair in isolation.
Set Bars to calculate, Symbols prefix, Symbols suffix, Average_Period, and Average method to match the broker symbols and the amount of smoothing required.
Where it helps
Summarizes dollar strength across the six source currency pairs.
Uses an average period and method to reduce short-term noise.
Allows prefix and suffix adjustments when currency names differ.
MT5 Indicator Parameters
The table below lists the available MT5 indicator parameters. You can customize these options in the MetaTrader Inputs dialog to match your trading preferences.
| Parameter | Description |
|---|---|
| inpBarsToCalculate | Sets this calculation or display option. Default: 500. |
| inpSymbolsPrefix | Controls this indicator option. Default: "". |
| inpSymbolsSuffix | Controls this indicator option. Default: "". |
| Average_Period | Sets this calculation or display option. Default: 100. |
| inpMaMethod | Controls this indicator option. Default: ma_ema. |
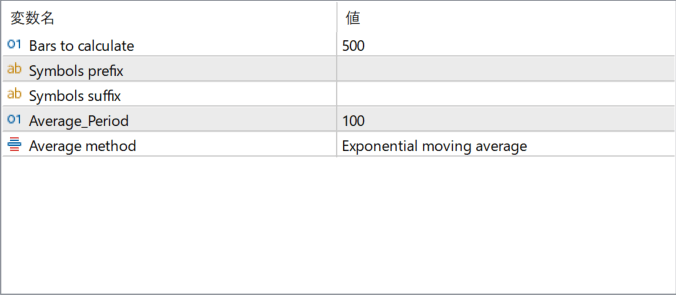
The screenshot above shows the default input parameters in the MT5 settings window.
How to Install .ex5 Indicator in MetaTrader 5
- Download the ZIP file and extract it.
- In MT5, select File → Open Data Folder.
- Open MQL5 → Indicators and copy the EX5 or MQ5 file into it.
- If the package includes library files, copy them to MQL5 → Libraries. Copy TPL files to the top-level templates folder.
- Restart MT5, find the indicator in the Navigator, and drag it onto a chart.
Test the tool on a demo account first. File contents and required folders can vary between packages.


