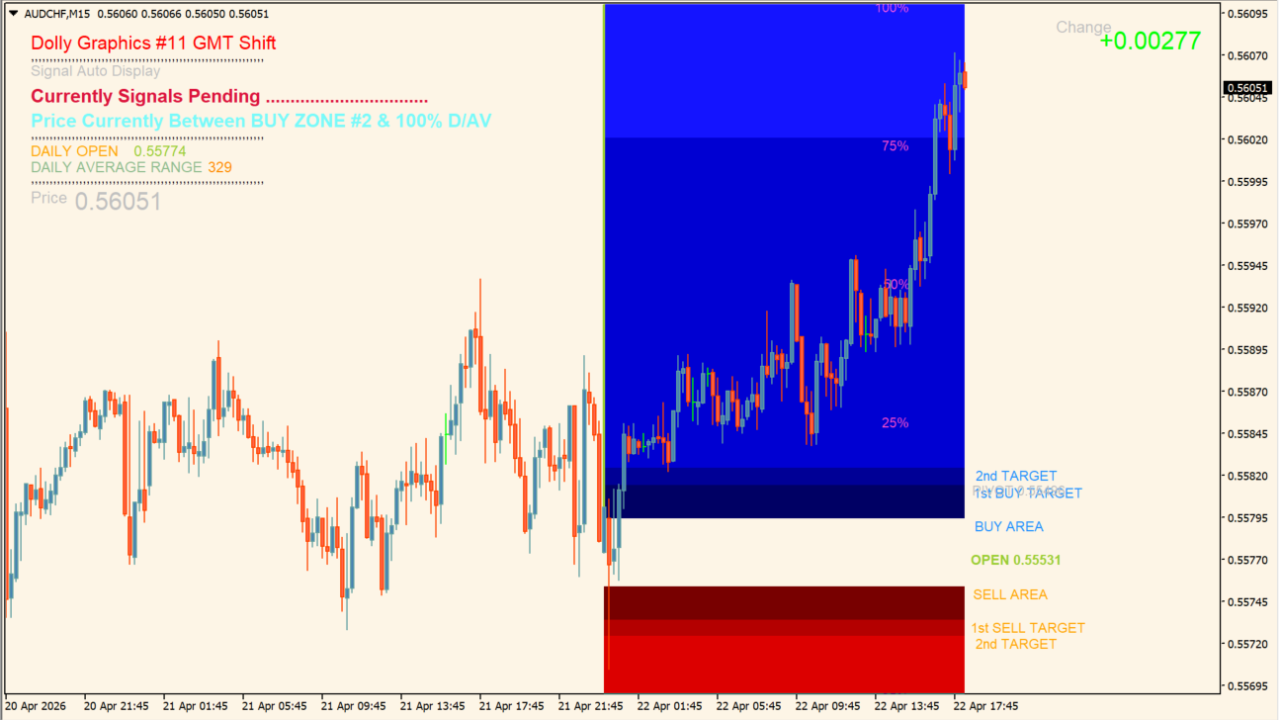
What is Dolly_Graphics_v1.1-GMTShift?
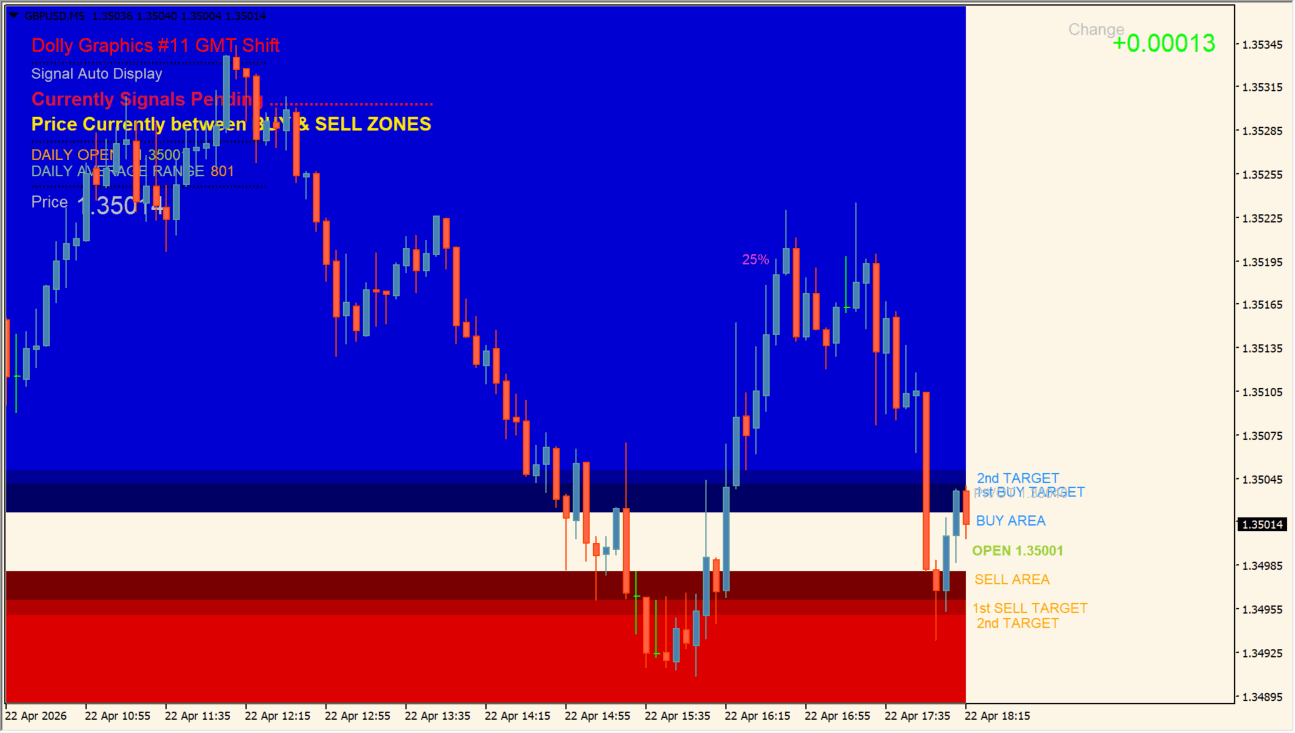
Dolly_Graphics_v1.1-GMTShift plots automatic buy/sell zones, daily average range lines, and pivot levels on the MT4 chart.
It features a customizable GMT shift setting to align daily range and pivot calculations with your broker server time.
How to use Dolly_Graphics_v1.1-GMTShift
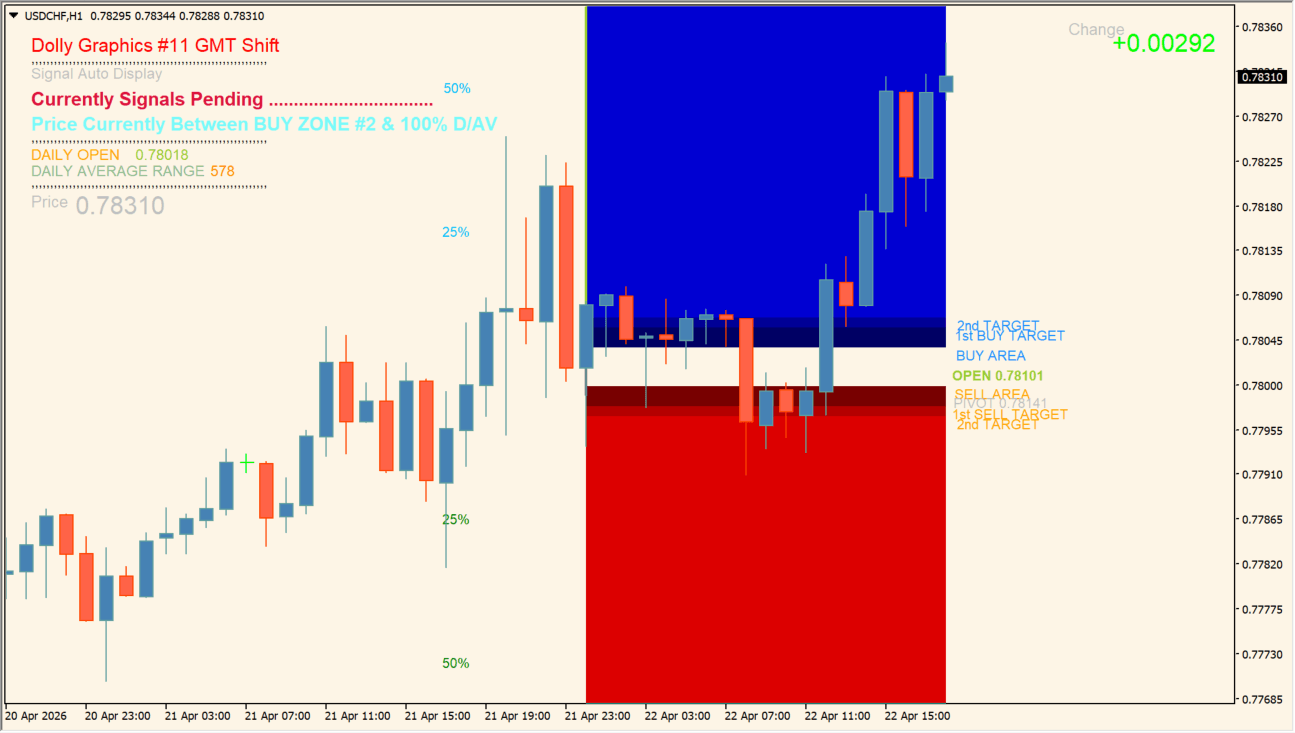
Use the colored BUY and SELL zones alongside daily average range lines to identify key intraday reference levels.
Adjust GMTShift, alert toggles, zone colors, and pivot line options in the Inputs tab.
Where it helps
Plots BUY and SELL target zones dynamically on the main chart.
Aligns daily calculation boundaries with broker server time.
Includes daily average range, pivot points, and daily open levels.
MT4 Indicator Parameters
The table below lists the available MT4 indicator parameters. You can customize these options in the MetaTrader Inputs dialog to match your trading preferences.
| Parameter | Description |
|---|---|
| GMTShift | Adjusts broker server time offset for daily calculations. Default: 2. |
| Using_OpenGraphics | Controls whether open price graphic elements are displayed. Default: true. |
| Dolly_GRAPHICS | Controls display of Dolly buy/sell graphic zones. Default: true. |
| Alert_ON | Enables or disables pop-up alert notifications. Default: false. |
| Auto_Signals | Controls display of automatic signal markers. Default: true. |
| Show_DollyCOMMENTS | Controls display of on-chart text comments. Default: true. |
| BUY_Color_2 | Sets the primary BUY zone color. Default: clrDodgerBlue. |
| BUY_Color_1 | Sets the secondary BUY zone color. Default: clrDeepSkyBlue. |
| SELL_Color_1 | Sets the secondary SELL zone color. Default: clrTomato. |
| SELL_Color_2 | Sets the primary SELL zone color. Default: clrCrimson. |
| BUY_Target_2 | Sets the second take-profit target distance for BUY trades. Default: 50. |
| BUY_Target_1 | Sets the first take-profit target distance for BUY trades. Default: 25. |
| BUY_Area | Sets the BUY zone range width. Default: 10. |
| SELL_Area | Sets the SELL zone range width. Default: 10. |
| SELL_Target_1 | Sets the first take-profit target distance for SELL trades. Default: 25. |
| SELL_Target_2 | Sets the second take-profit target distance for SELL trades. Default: 50. |
| SHIFT_DollyText | Sets horizontal text offset for Dolly labels. Default: 10. |
| Show_DailyAverageGRAPHICS | Controls display of Daily Average range graphics. Default: true. |
| Daily_AverageGRAPHICS | Controls display of Daily Average range lines. Default: true. |
| DAILY_Av_UP_Color_150 | Sets the color for 150% upper daily average line. Default: clrBlue. |
| DAILY_Av_UP_Color_125 | Sets the color for 125% upper daily average line. Default: clrAqua. |
| DAILY_Av_UP_Color_100 | Sets the color for 100% upper daily average line. Default: clrLightBlue. |
| DAILY_Av_UP_Color_75 | Sets the color for 75% upper daily average line. Default: clrPowderBlue. |
| DAILY_Av_DN_Color_75 | Sets the color for 75% lower daily average line. Default: clrMistyRose. |
| DAILY_Av_DN_Color_100 | Sets the color for 100% lower daily average line. Default: clrPink. |
| DAILY_Av_DN_Color_125 | Sets the color for 125% lower daily average line. Default: clrDeepPink. |
| DAILY_Av_DN_Color_150 | Sets the color for 150% lower daily average line. Default: clrRed. |
| SHIFT_DailyAverageText | Sets horizontal text offset for Daily Average labels. Default: 10. |
| Show_PivotLines | Controls display of Pivot Point lines. Default: true. |
| Show_M_PivotLines | Controls display of Mid Pivot lines. Default: false. |
| SHIFT_PivotPointText | Sets horizontal text offset for Pivot Point labels. Default: 10. |
| PivotPoint_ExtendLINE | Controls whether Pivot Point lines extend across the chart. Default: true. |
| Show_FibLines | Controls display of Fibonacci lines. Default: true. |
| Show_EXTRAFibLines | Controls display of extra Fibonacci lines. Default: false. |
| SHIFT_FibText | Sets horizontal text offset for Fibonacci labels. Default: 10. |
| FIB_ExtendDISPLAY | Controls whether Fibonacci lines extend across display. Default: true. |
| Show_Daily_HI_LOW | Controls display of Daily High and Low lines. Default: true. |
| SHIFT_HI_LOW_TEXT | Sets horizontal text offset for High/Low labels. Default: 10. |
| Show_Daily_OPEN | Controls display of Daily Open line. Default: true. |
| SHIFT_Daily_OPEN_TEXT | Sets horizontal text offset for Daily Open label. Default: 10. |
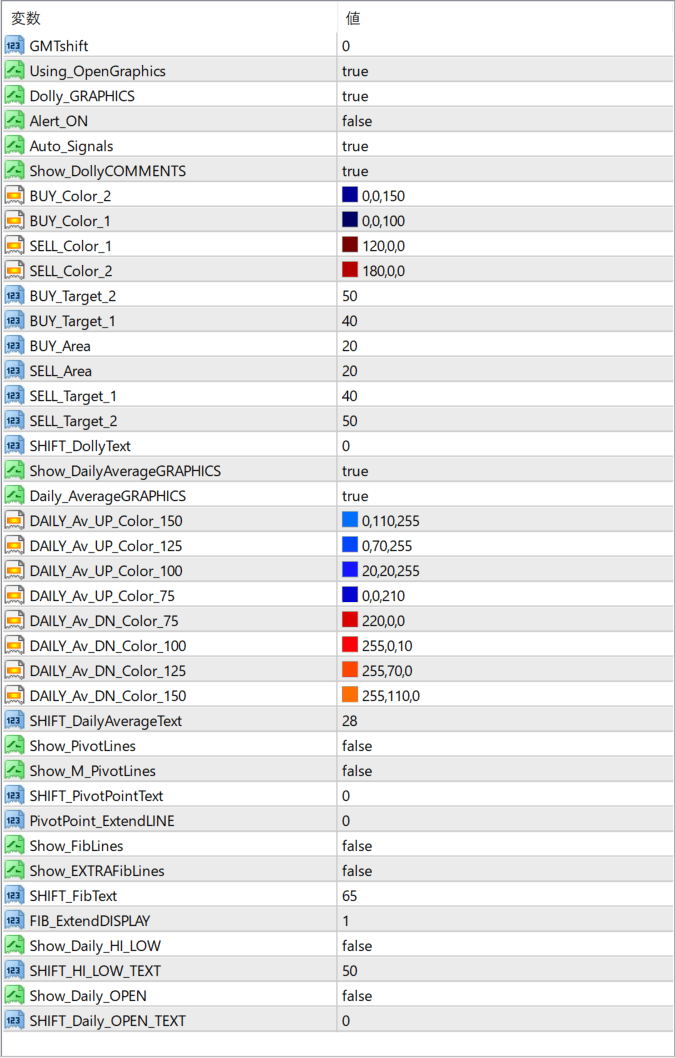
The screenshot above shows the default input parameters in the MT4 settings window.
How to Install .ex4 Indicator in MetaTrader 4
- Download the ZIP file and extract it.
- In MT4, select File → Open Data Folder.
- Open MQL4 → Indicators and copy the EX4 or MQ4 file into it.
- If the package includes library files, copy them to MQL4 → Libraries. Copy TPL files to the top-level templates folder.
- Restart MT4, find the indicator in the Navigator, and drag it onto a chart.
Test the tool on a demo account first. File contents and required folders can vary between packages.


