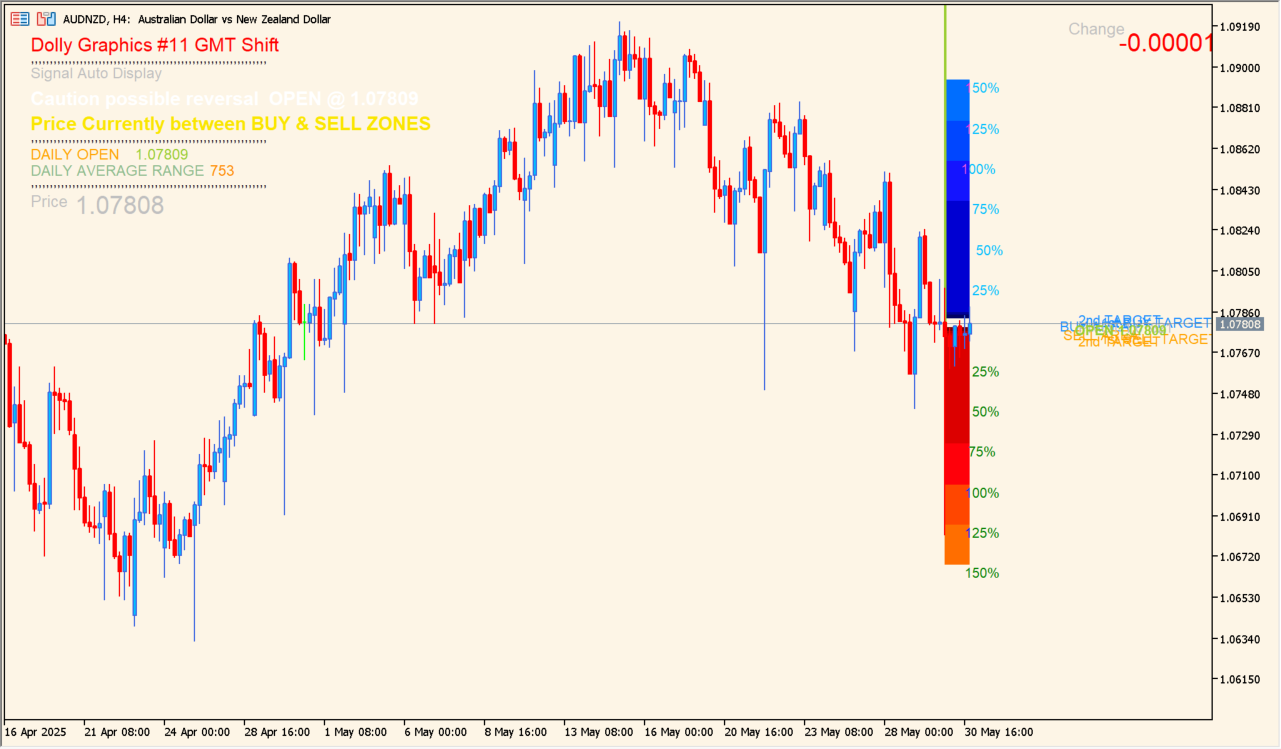
What is Dolly_Graphics_v11-GMTShift?
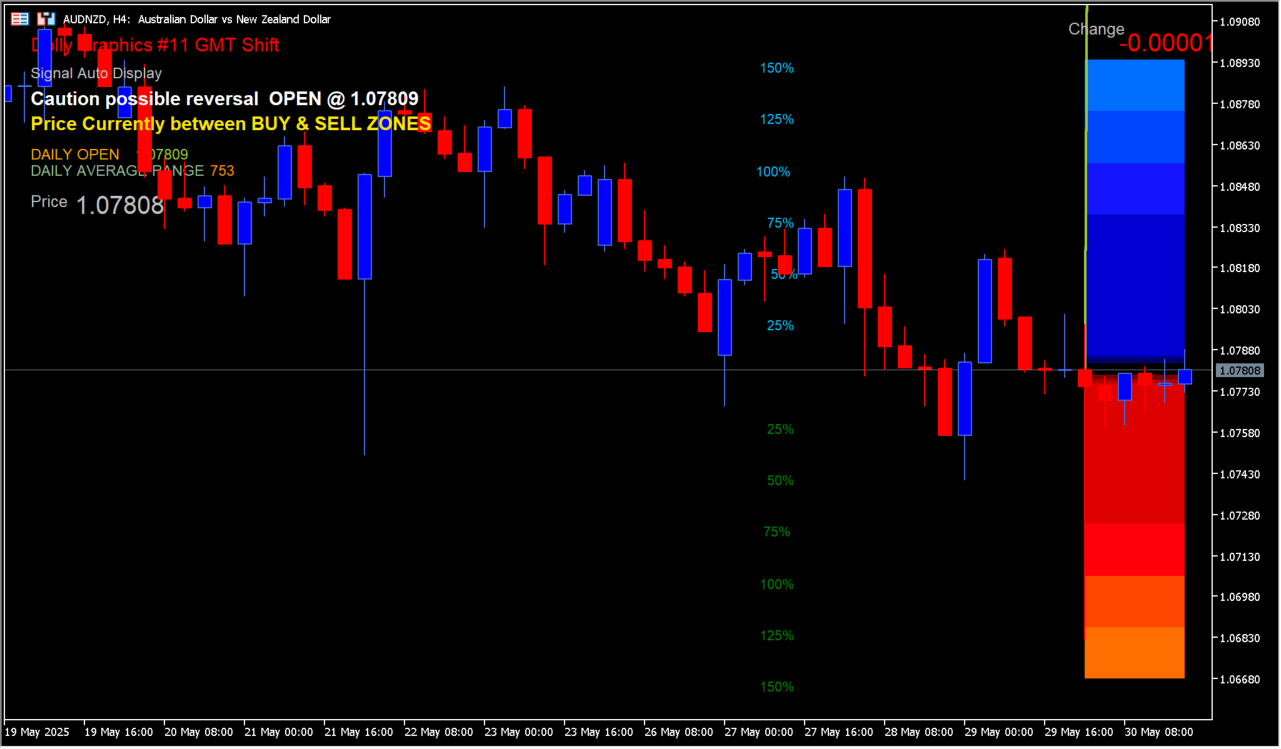
Dolly_Graphics_v11-GMTShift draws a daily zone map from the prior high and low, Fibonacci retracement levels, pivot lines, and daily averages. Blue BUY and red SELL areas provide a visual distinction between the configured zones.
The display includes many optional labels, targets, and graphics. GMTShift is important because the daily boundaries depend on the broker server time and the intended GMT offset.
How to use Dolly_Graphics_v11-GMTShift
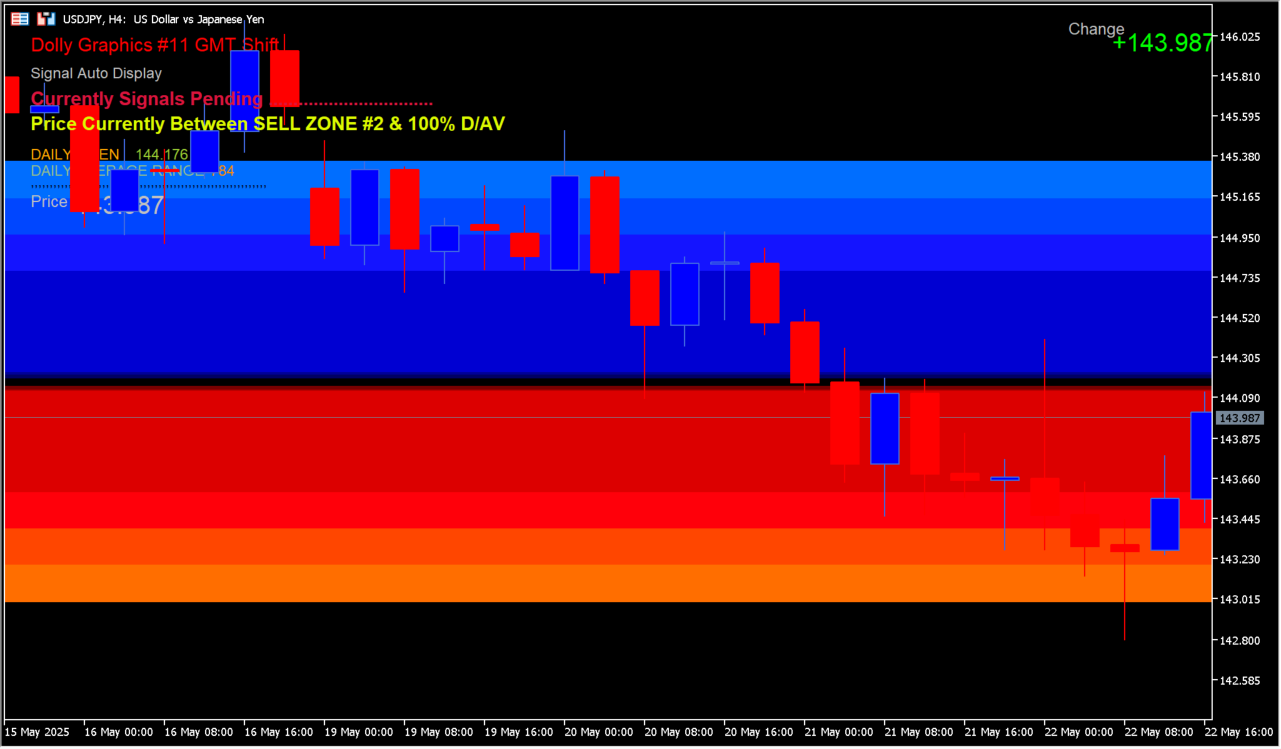
Add Dolly_Graphics_v11-GMTShift to an MT5 chart and first confirm that GMTShift matches the broker server time and seasonal offset.
Toggle the zone graphics, labels, pivots, Fibonacci lines, daily average, targets, and colors until the daily map remains readable on your working timeframe.
Where it helps
Combines prior-day levels, pivots, Fibonacci references, and daily averages in one view.
Separates the two configured zone directions with blue and red areas.
Provides a dedicated offset setting for matching the broker day boundary.
MT5 Indicator Parameters
The table below lists the available MT5 indicator parameters. You can customize these options in the MetaTrader Inputs dialog to match your trading preferences.
| Parameter | Description |
|---|---|
| GMTshift | Sets this calculation or display option. Default: 0. |
| Using_OpenGraphics | Enables or disables this display option. Default: true. |
| Dolly_GRAPHICS | Enables or disables this display option. Default: true. |
| Alert_ON | Enables or disables this display option. Default: false. |
| Auto_Signals | Enables or disables this display option. Default: true. |
| Show_DollyCOMMENTS | Enables or disables this display option. Default: true. |
| BUY_Color_2 | Sets the display color for this option. Default: C'0. |
| BUY_Color_1 | Sets the display color for this option. Default: C'0. |
| SELL_Color_1 | Sets the display color for this option. Default: C'120. |
| SELL_Color_2 | Sets the display color for this option. Default: C'180. |
| BUY_Target_2 | Controls this indicator option. Default: 50. |
| BUY_Target_1 | Controls this indicator option. Default: 40. |
| BUY_Area | Controls this indicator option. Default: 20. |
| SELL_Area | Controls this indicator option. Default: 20. |
| SELL_Target_1 | Controls this indicator option. Default: 40. |
| SELL_Target_2 | Controls this indicator option. Default: 50. |
| SHIFT_DailyText | Sets this calculation or display option. Default: 0. |
| Show_DailyAverageGRAPHICS | Enables or disables this display option. Default: true. |
| Daily_AverageGRAPHICS | Enables or disables this display option. Default: true. |
| DAILY_Av_UP_Color_150 | Sets the display color for this option. Default: C'0. |
| DAILY_Av_UP_Color_125 | Sets the display color for this option. Default: C'0. |
| DAILY_Av_UP_Color_100 | Sets the display color for this option. Default: C'20. |
| DAILY_Av_UP_Color_75 | Sets the display color for this option. Default: C'0. |
| DAILY_Av_DN_Color_75 | Sets the display color for this option. Default: C'220. |
| DAILY_Av_DN_Color_100 | Sets the display color for this option. Default: C'255. |
| DAILY_Av_DN_Color_125 | Sets the display color for this option. Default: C'255. |
| DAILY_Av_DN_Color_150 | Sets the display color for this option. Default: C'255. |
| SHIFT_DailyAverageText | Sets this calculation or display option. Default: 28. |
| Show_PivotLines | Enables or disables this display option. Default: false. |
| Show_M_PivotLines | Enables or disables this display option. Default: false. |
| SHIFT_Pivot_PointText | Sets this calculation or display option. Default: 0. |
| Pivot_Point_ExtendLINE | Controls this indicator option. Default: 0. |
| Show_FibLines | Enables or disables this display option. Default: false. |
| Show_EXTRAFibLines | Enables or disables this display option. Default: false. |
| SHIFT_FibText | Sets this calculation or display option. Default: 65. |
| FIB_ExtendDISPLAY | Enables or disables this display option. Default: 1. |
| Show_Daily_HI_LOW | Enables or disables this display option. Default: false. |
| SHIFT_HI_LOW_TEXT | Sets this calculation or display option. Default: 50. |
| Show_Daily_OPEN | Enables or disables this display option. Default: false. |
| SHIFT_Daily_OPEN_TEXT | Sets this calculation or display option. Default: 0. |
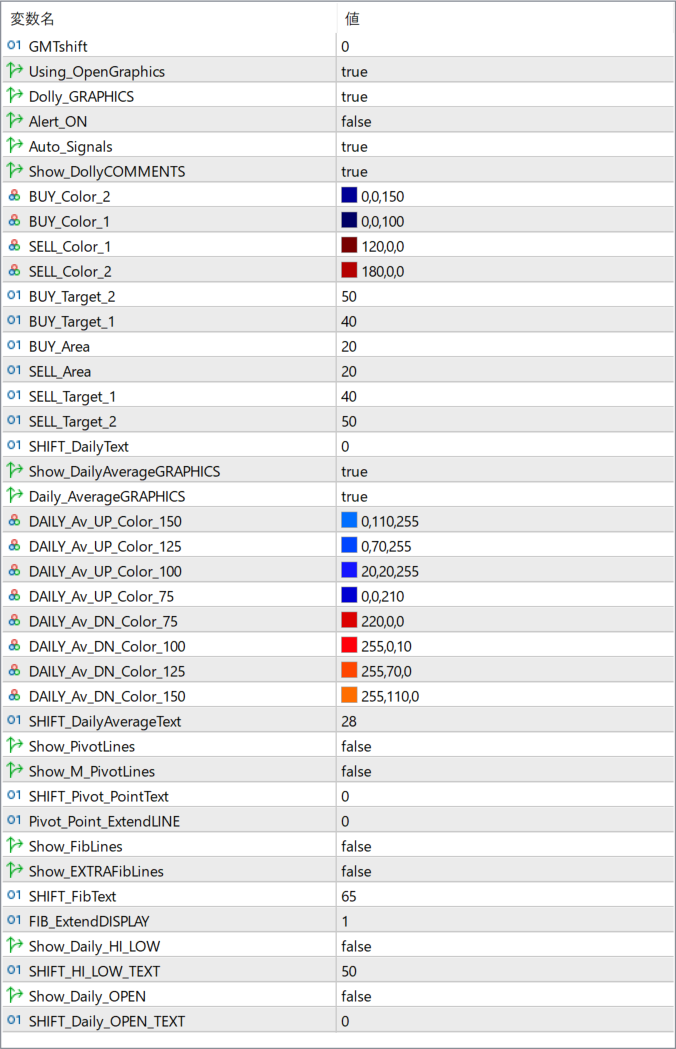
The screenshot above shows the default input parameters in the MT5 settings window.
How to Install .ex5 Indicator in MetaTrader 5
- Download the ZIP file and extract it.
- In MT5, select File → Open Data Folder.
- Open MQL5 → Indicators and copy the EX5 or MQ5 file into it.
- If the package includes library files, copy them to MQL5 → Libraries. Copy TPL files to the top-level templates folder.
- Restart MT5, find the indicator in the Navigator, and drag it onto a chart.
Test the tool on a demo account first. File contents and required folders can vary between packages.


