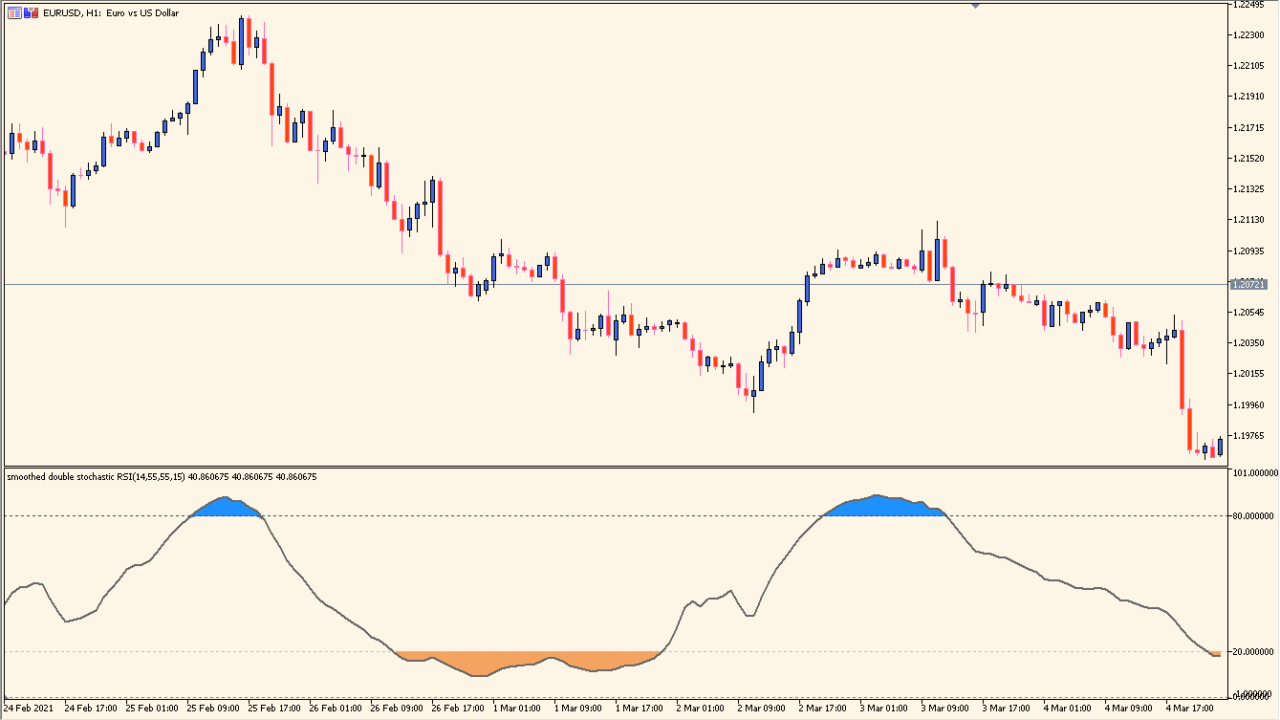
What is double_stochastic_rsi Indicator?
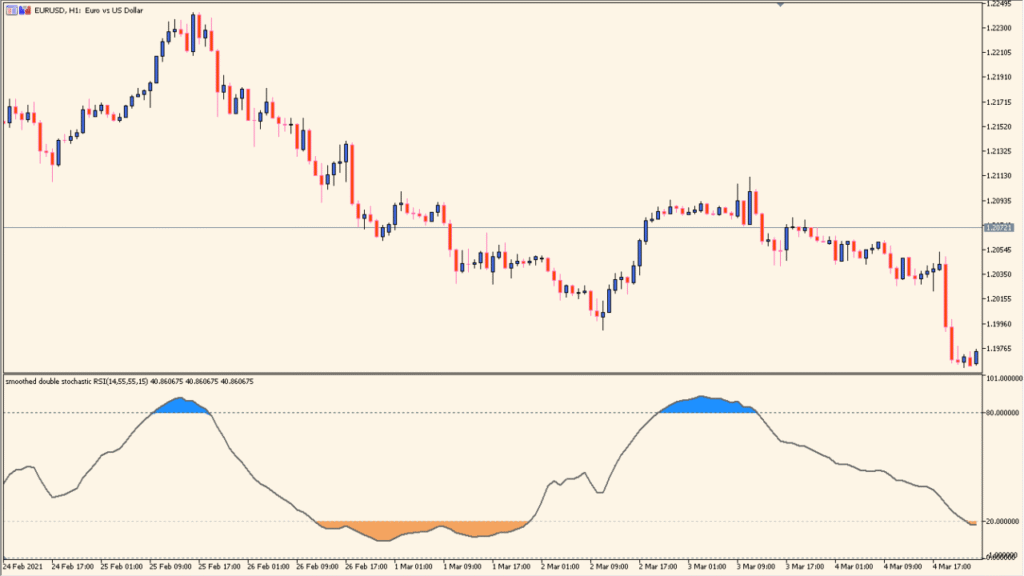
Double Stochastic RSI for MT5 applies two stochastic calculations to an RSI base, creating a compact oscillator for reviewing momentum and extreme levels. The display includes reference levels such as 20 and 80.
RSI period, applied price, the two stochastic periods, smoothing, and level settings control the calculation. The layered display can be compared with price structure when reviewing range and momentum changes.
How to Use It in Practice
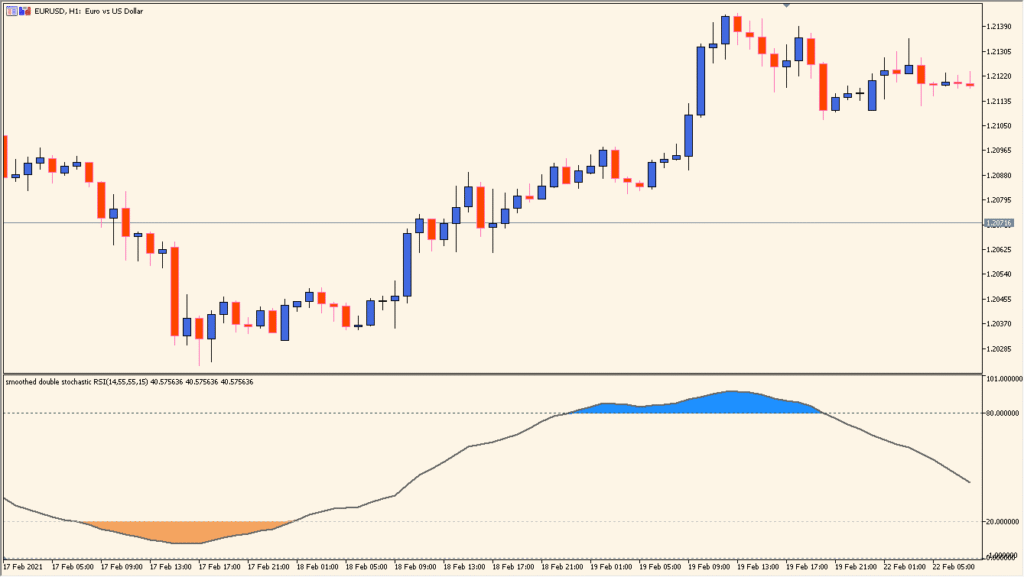
Read the two colored regions in the subwindow: the yellow region is the displayed oversold area and the blue region is the displayed overbought area. The oscillator is easier to compare on a 15-minute or higher chart, where the RSI and Stochastic layers can be viewed against a broader candle sequence.
- Compare the yellow and blue areas with the oscillator's movement and the related price swings on the main chart.
- Use the RSI period and Applied price to inspect a different RSI base.
- Set the first and second Stochastic periods and their smoothing Inputs to alter the layered oscillator response.
- Review the displayed regions and line movement on a 15-minute or higher chart if a broader comparison is needed.
RSI and two stochastic layers are combined in one panel, reference levels provide consistent chart context, and the calculation periods can be adjusted.
MT5 Indicator Parameters
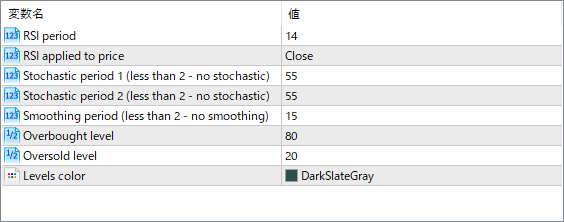
The screenshot above shows the default input parameters in the MT5 settings window.
| Parameter | Description |
|---|---|
| RSI period | Sets the number of candles used to calculate the RSI base line before the stochastic is applied. |
| RSI applied to price | Determines which price type (e.g., Close, Open) the RSI is calculated on. |
| Stochastic period 1 | Defines the lookback period for the first stochastic smoothing. If less than 2, this layer is skipped. |
| Stochastic period 2 | Defines the lookback period for the second stochastic smoothing. If less than 2, this layer is skipped. |
| Smoothing period | Controls how smooth the final output line is by applying additional moving average smoothing. |
| Overbought level | Sets the upper threshold, often used to identify when the market is potentially overbought. |
| Oversold level | Sets the lower threshold, signaling a potentially oversold market. |
| Levels color | Changes the color of the overbought and oversold guide levels for visual clarity. |


