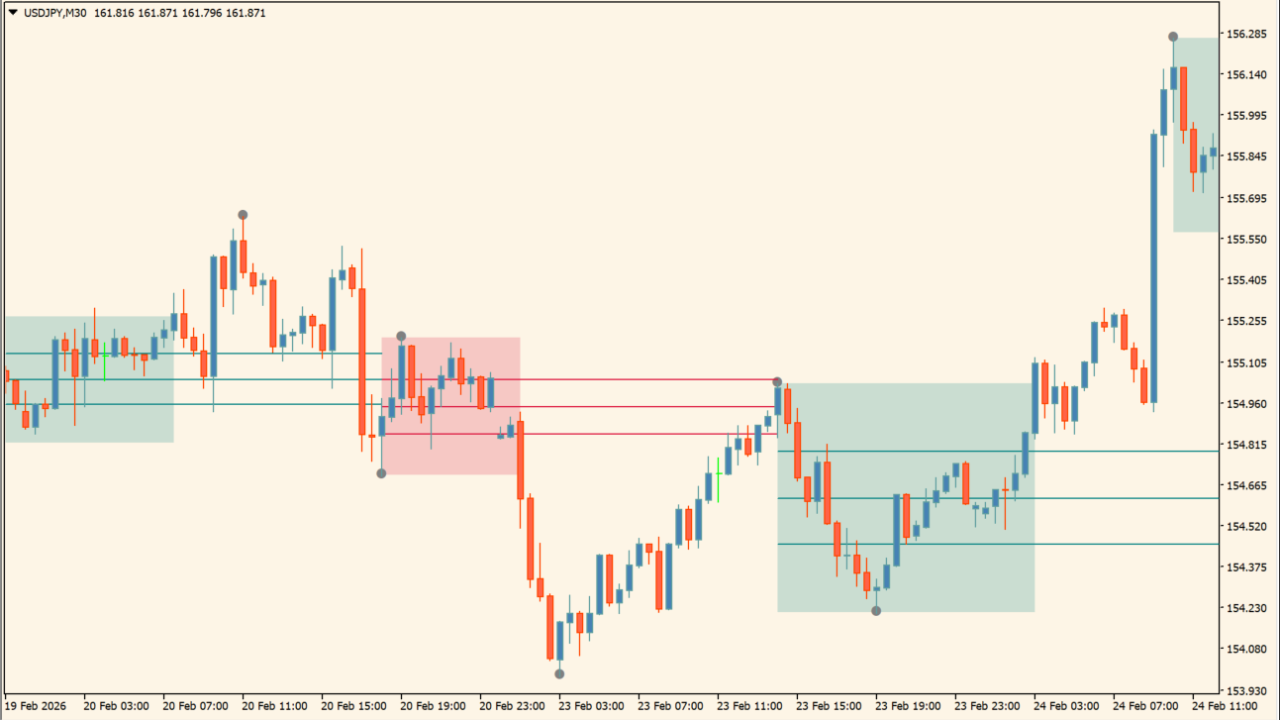
What is DTEX Algo Zones?
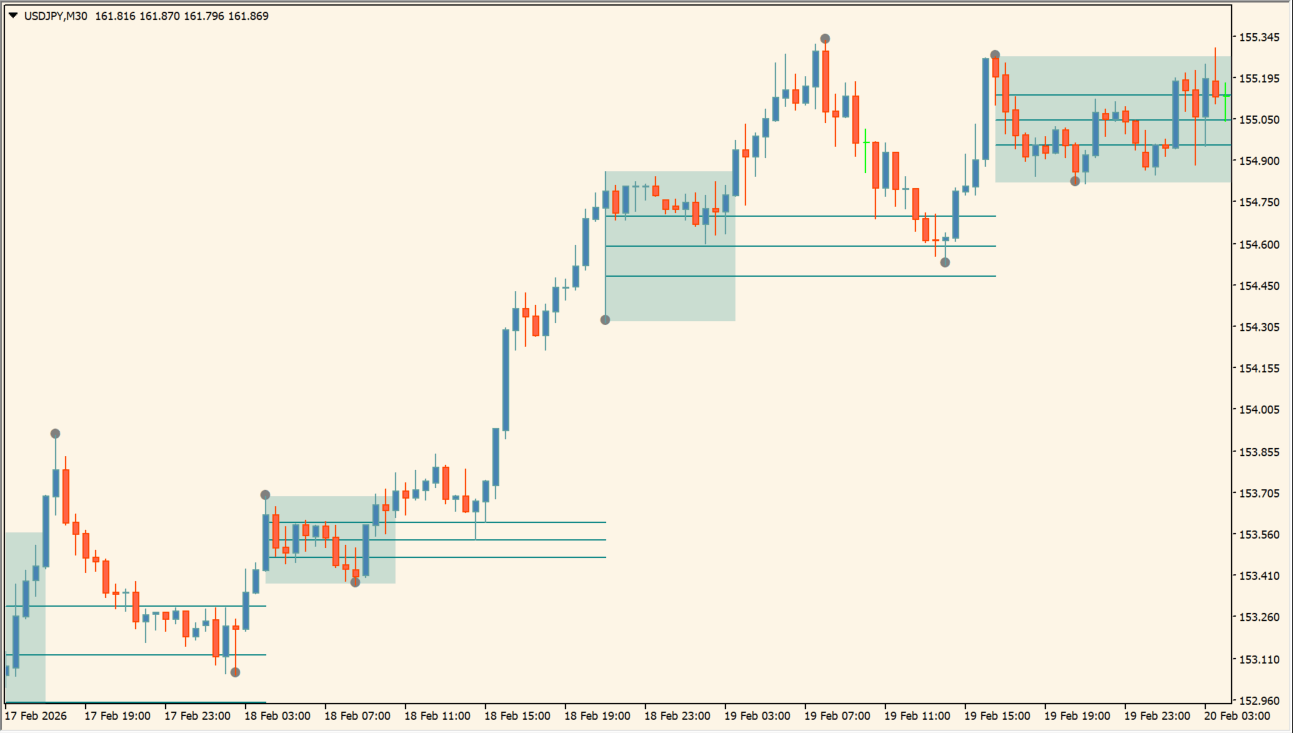
DTEX Algo Zones is an MT4 indicator that displays colored zones around detected swing structure. Swing markers identify the reference points, while configurable Fibonacci levels organize the displayed range.
Bullish and bearish colors separate the mapped areas for visual comparison. The zones and levels provide chart context without implying a fixed reaction or future price path.
How to use DTEX Algo Zones
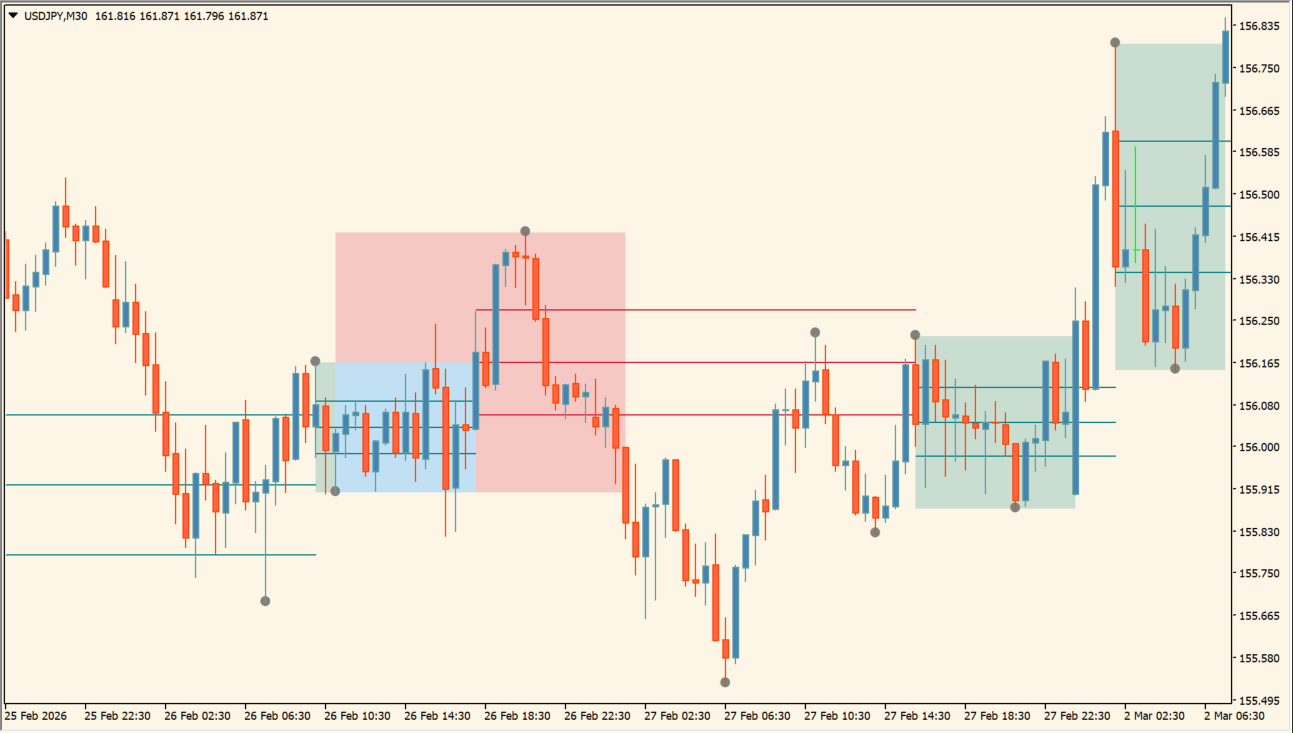
Read the teal zone as the displayed upward swing range and the red zone as the displayed downward swing range. Gray circles show the high or low used as each swing anchor; the horizontal lines inside the zone are the configured Fibonacci levels, so the zone shows a range and the lines show positions within that range.
Where it helps
Swing anchors make the mapped structure easier to locate, Fibonacci levels add a consistent reference framework, and colored zones keep the chart organized.
MT4 Indicator Parameters
The table below lists the available MT4 indicator parameters. You can customize these options in the MetaTrader Inputs dialog to match your trading preferences.
| Parameter | Description |
|---|---|
| Structure Section | Labels the market structure configuration section. |
| Show Swing Points | Shows or hides gray swing point markers on chart. Default: true. |
| Structure Length | Controls the lookback window length used to identify market structure zones. Default: 10. |
| Zones Section | Labels the zone display configuration section. |
| Show Last | Sets how many recent market structure zones remain prominently displayed. Default: 1. |
| Display All Zones | Keeps all historical structure zones visible across chart history. Default: true. |
| Zone Display | Selects whether to display bullish, bearish, or both structure zone types. Default: Both. |
| Clean-Up Level Overlap | Reduces visual chart clutter by removing overlapping horizontal levels. Default: true. |
| Fib Level 1 Section | Labels the first Fibonacci level configuration section. |
| Fib Level 1 Toggle | Enables or disables the display of the first Fibonacci level. Default: false. |
| Fib Level 1 | Sets the ratio value for the first Fibonacci level. Default: 0.0. |
| Fib Level 1 Style | Sets the line style pattern for the first Fibonacci level. Default: Dot. |
| Fib Level 1 Bull Color | Sets the bullish line color for the first Fibonacci level. Default: Teal. |
| Fib Level 1 Bear Color | Sets the bearish line color for the first Fibonacci level. Default: Crimson. |
| Fib Level 2 Section | Labels the second Fibonacci level configuration section. |
| Fib Level 2 Toggle | Enables or disables the display of the second Fibonacci level. Default: true. |
| Fib Level 2 | Sets the ratio value for the second Fibonacci level. Default: 0.3. |
| Fib Level 2 Style | Sets the line style pattern for the second Fibonacci level. Default: Dash. |
| Fib Level 2 Bull Color | Sets the bullish line color for the second Fibonacci level. Default: Teal. |
| Fib Level 2 Bear Color | Sets the bearish line color for the second Fibonacci level. Default: Crimson. |
| Fib Level 3 Section | Labels the third Fibonacci level configuration section. |
| Fib Level 3 Toggle | Enables or disables the display of the third Fibonacci level. Default: true. |
| Fib Level 3 | Sets the ratio value for the third Fibonacci level. Default: 0.5. |
| Fib Level 3 Style | Sets the line style pattern for the third Fibonacci level. Default: Solid. |
| Fib Level 3 Bull Color | Sets the bullish line color for the third Fibonacci level. Default: Teal. |
| Fib Level 3 Bear Color | Sets the bearish line color for the third Fibonacci level. Default: Crimson. |
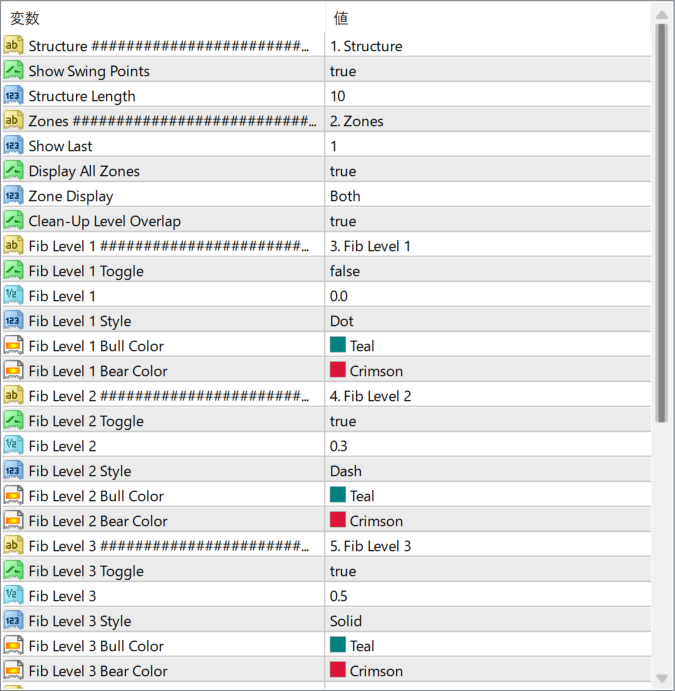
The screenshot above shows the default input parameters in the MT4 settings window.
How to Install .ex4 Indicator in MetaTrader 4
- Download the ZIP file and extract it.
- In MT4, select File → Open Data Folder.
- Open MQL4 → Indicators and copy the EX4 or MQ4 file into it.
- If the package includes library files, copy them to MQL4 → Libraries. Copy TPL files to the top-level templates folder.
- Restart MT4, find the indicator in the Navigator, and drag it onto a chart.
Test the tool on a demo account first. File contents and required folders can vary between packages.


