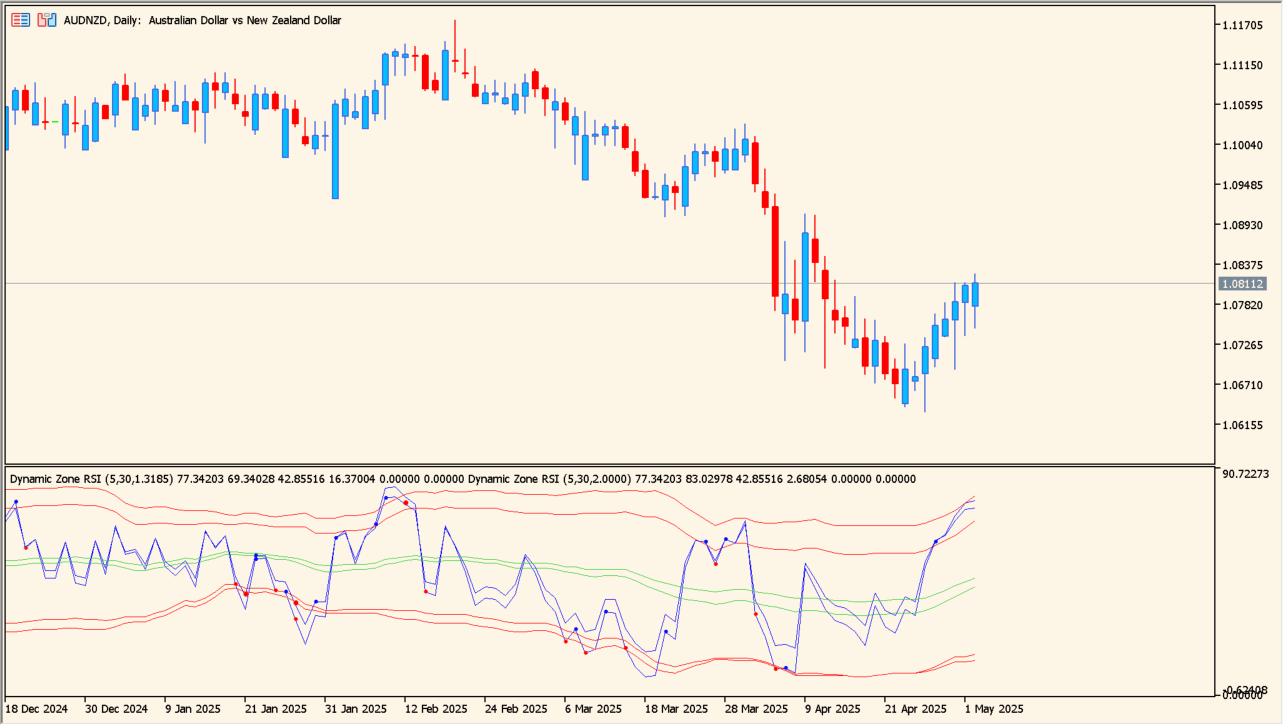
What is dynamic-zone-rsi?
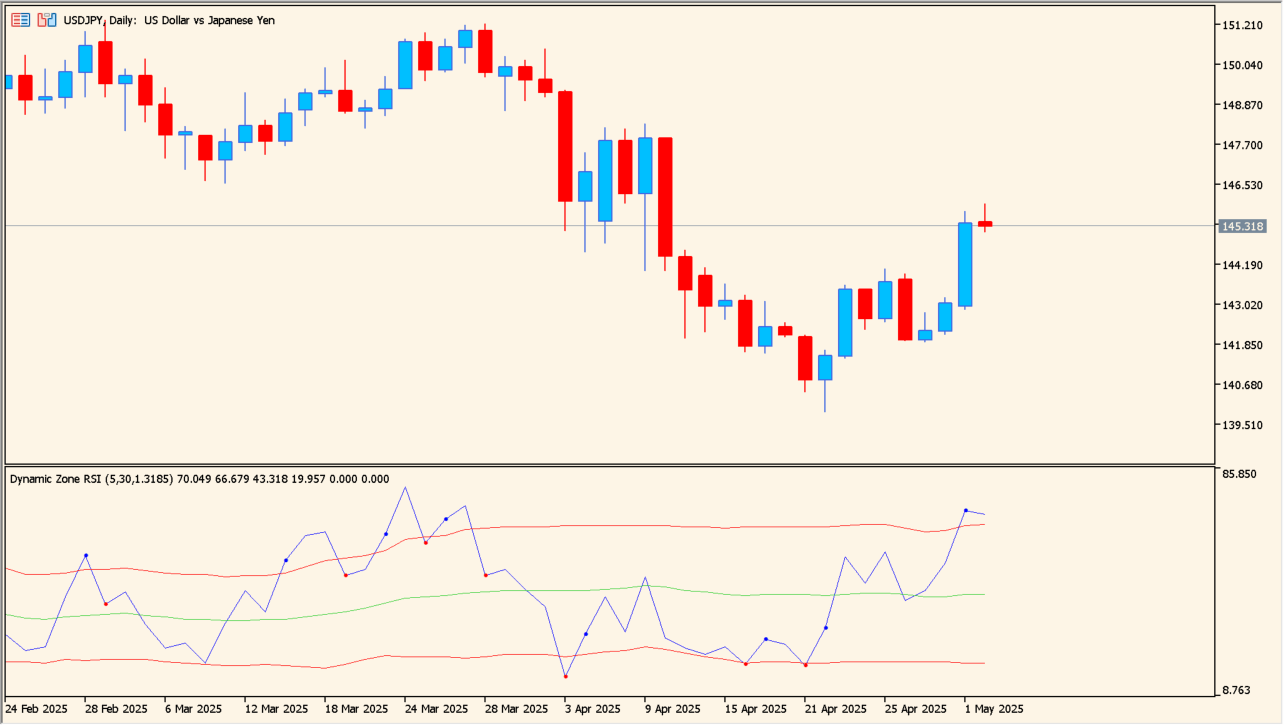
Dynamic Zone RSI pairs an RSI line with a custom dynamic zone whose width changes more smoothly than ordinary Bollinger Bands. The display is designed to make overextended movement easier to see.
Markers can appear when RSI crosses the center or leaves a band and returns. The tool is more suited to range and mean-reversion review than to following every trend move.
How to use dynamic-zone-rsi
Place dynamic-zone-rsi on an MT5 chart and inspect the dot markers together with the center line and upper or lower band.
Adjust RSI period, Bands period, and Deviation for the calculation, then choose whether intersection arrows, midline intersections, and alerts are enabled.
Where it helps
Frames RSI movement with a band that changes more gently than ordinary Bollinger Bands.
Highlights a move away from the zone and the subsequent return.
Allows arrows, midline intersections, and alerts to be managed independently.
MT5 Indicator Parameters
The table below lists the available MT5 indicator parameters. You can customize these options in the MetaTrader Inputs dialog to match your trading preferences.
| Parameter | Description |
|---|---|
| InpPeriodRSI | Sets this calculation or display option. Default: 5. |
| InpPeriodBB | Sets this calculation or display option. Default: 30. |
| InpDeviation | Controls this indicator option. Default: 1.3185. |
| InpShowArrows | Enables or disables this display option. Default: INPUT_YES. |
| InpUseMiddle | Enables or disables this display option. Default: INPUT_NO. |
| InpUseAlerts | Enables or disables this display option. Default: INPUT_NO. |
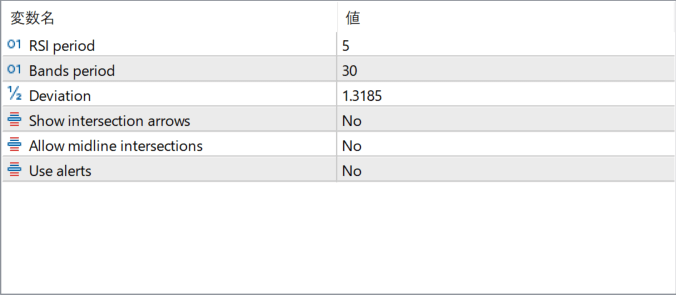
The screenshot above shows the default input parameters in the MT5 settings window.
How to Install .ex5 Indicator in MetaTrader 5
- Download the ZIP file and extract it.
- In MT5, select File → Open Data Folder.
- Open MQL5 → Indicators and copy the EX5 or MQ5 file into it.
- If the package includes library files, copy them to MQL5 → Libraries. Copy TPL files to the top-level templates folder.
- Restart MT5, find the indicator in the Navigator, and drag it onto a chart.
Test the tool on a demo account first. File contents and required folders can vary between packages.


