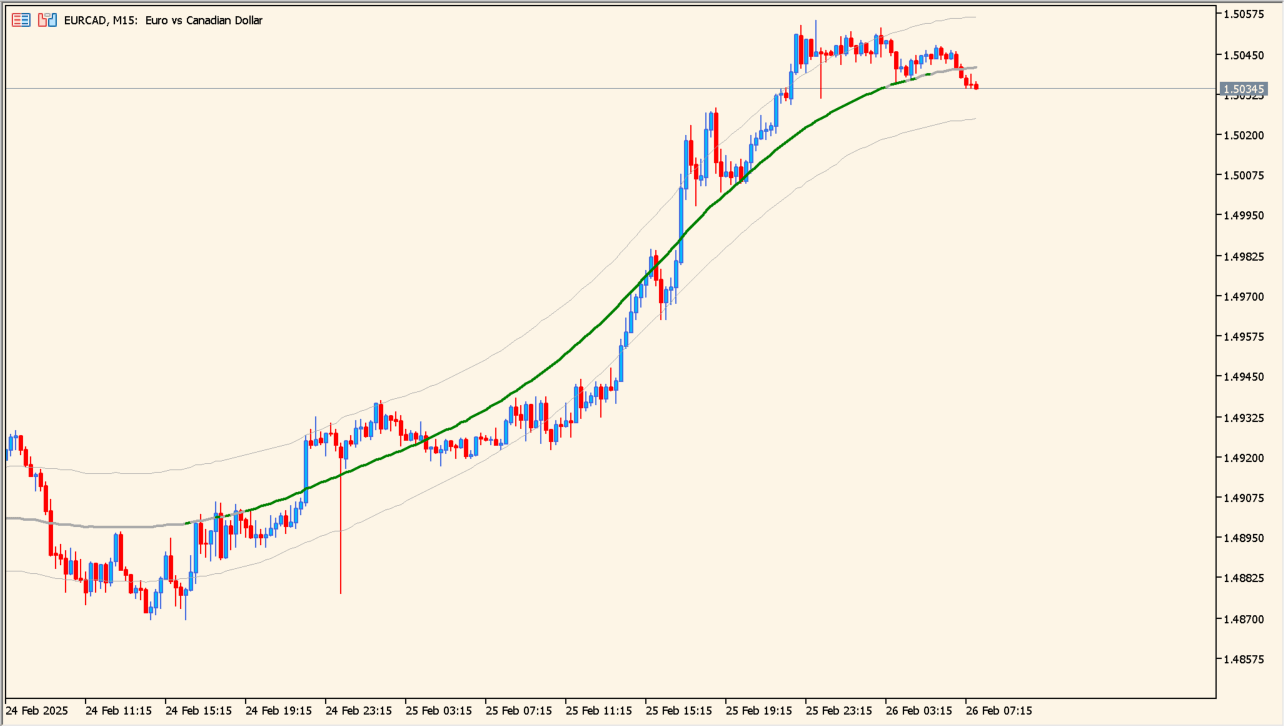
What is extreme-tma-line-indicator?
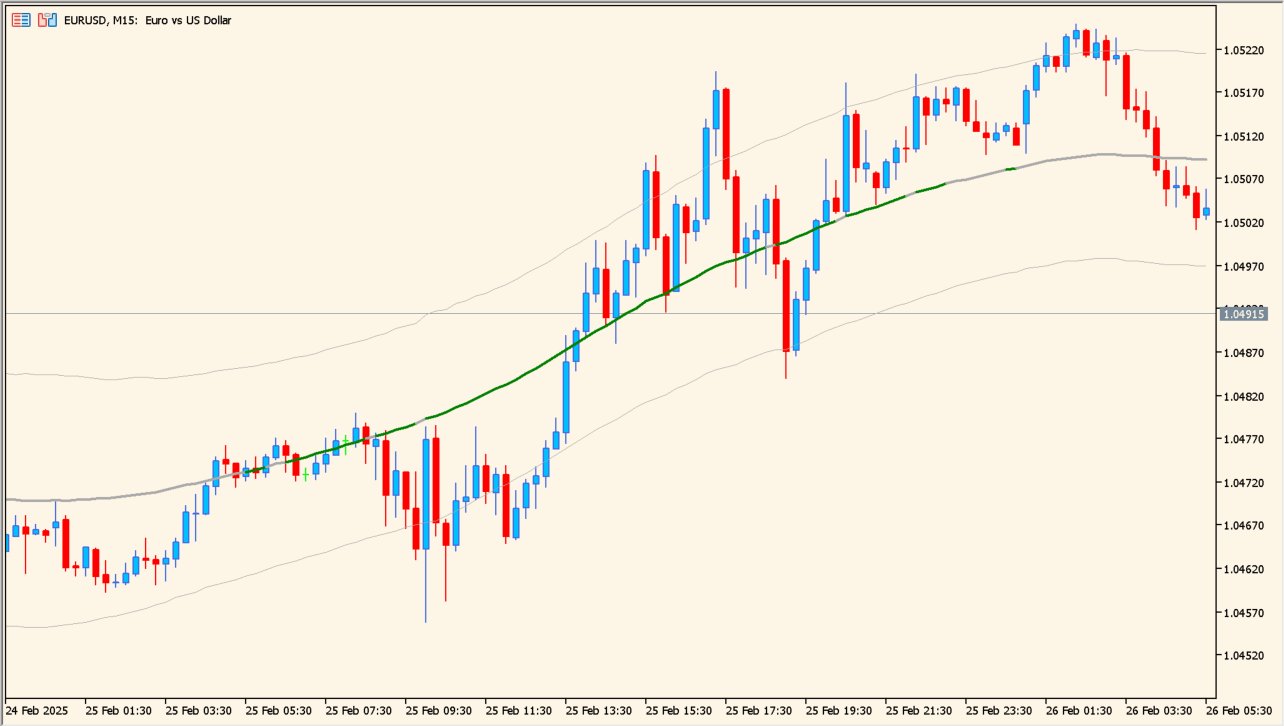
extreme-tma-line-indicator combines a Triangular Moving Average with upper and lower ATR-based bands. The central line changes between green and red for direction, while gray represents a range state.
TMA reduces short-term noise but introduces more lag than a simple or exponential average. ATR expands or contracts the bands with volatility, although the strong TMA smoothing can keep that width change moderate.
How to use extreme-tma-line-indicator
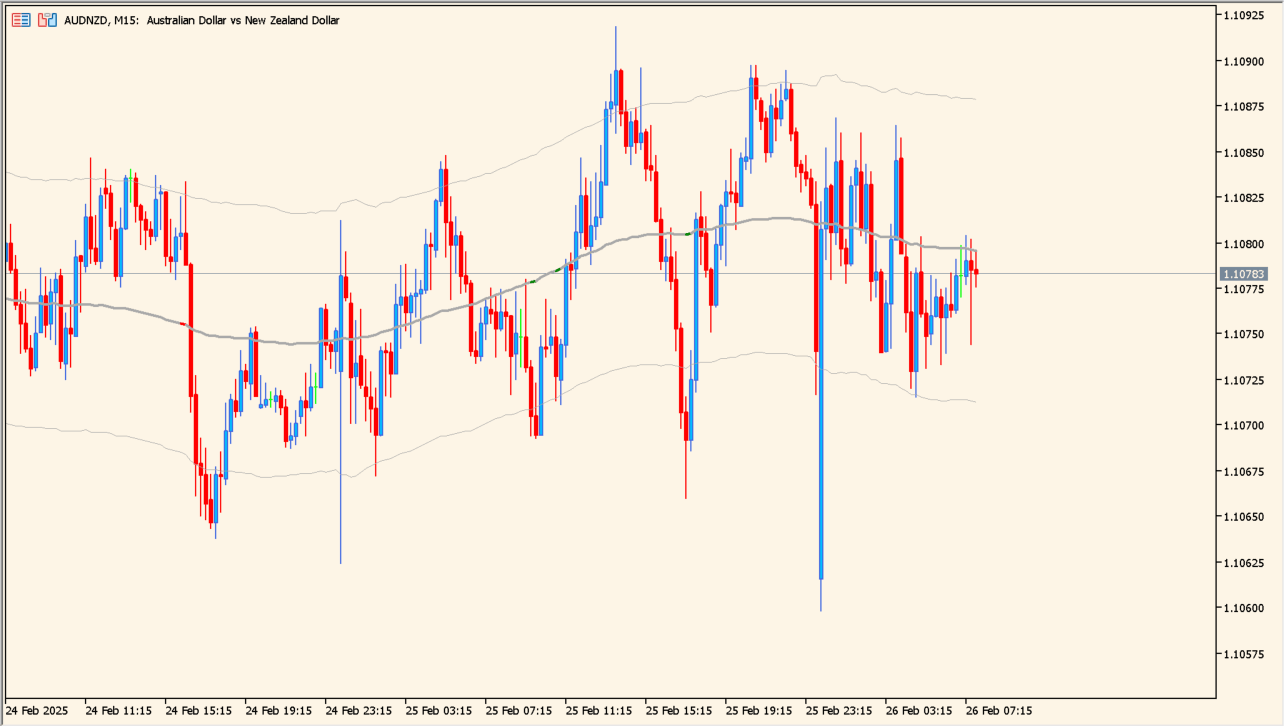
Apply extreme-tma-line-indicator to an MT5 chart and compare the green, red, or gray line state with the price position inside the bands.
Adjust InpPeriodTMA for smoothness, InpPeriodATR and InpMultiplierATR for band width, InpThreshold for trend sensitivity, and InpRedraw for update behavior.
Where it helps
Uses TMA to reduce small price fluctuations while keeping a directional line visible.
Uses ATR period and multiplier to frame wider or narrower movement.
The gray display separates range conditions from the rising and falling colors.
MT5 Indicator Parameters
The table below lists the available MT5 indicator parameters. You can customize these options in the MetaTrader Inputs dialog to match your trading preferences.
| Parameter | Description |
|---|---|
| InpPeriodTMA | Sets this calculation or display option. Default: 56. |
| InpPeriodATR | Sets this calculation or display option. Default: 100. |
| InpMultiplierATR | Sets this calculation or display option. Default: 2.0. |
| InpThreshold | Sets this calculation or display option. Default: 0.5. |
| InpRedraw | Enables or disables this display option. Default: INPUT_YES. |
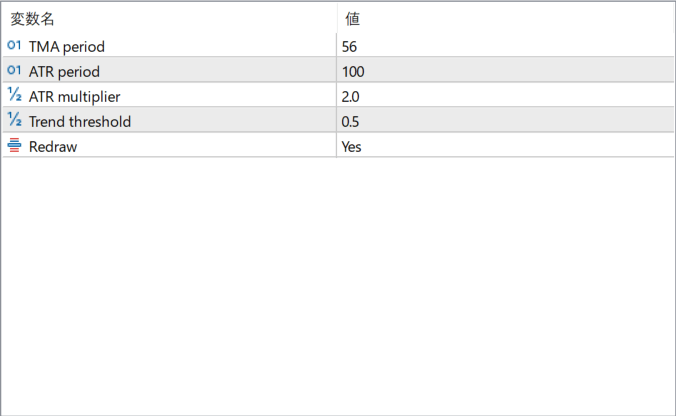
The screenshot above shows the default input parameters in the MT5 settings window.
How to Install .ex5 Indicator in MetaTrader 5
- Download the ZIP file and extract it.
- In MT5, select File → Open Data Folder.
- Open MQL5 → Indicators and copy the EX5 or MQ5 file into it.
- If the package includes library files, copy them to MQL5 → Libraries. Copy TPL files to the top-level templates folder.
- Restart MT5, find the indicator in the Navigator, and drag it onto a chart.
Test the tool on a demo account first. File contents and required folders can vary between packages.


