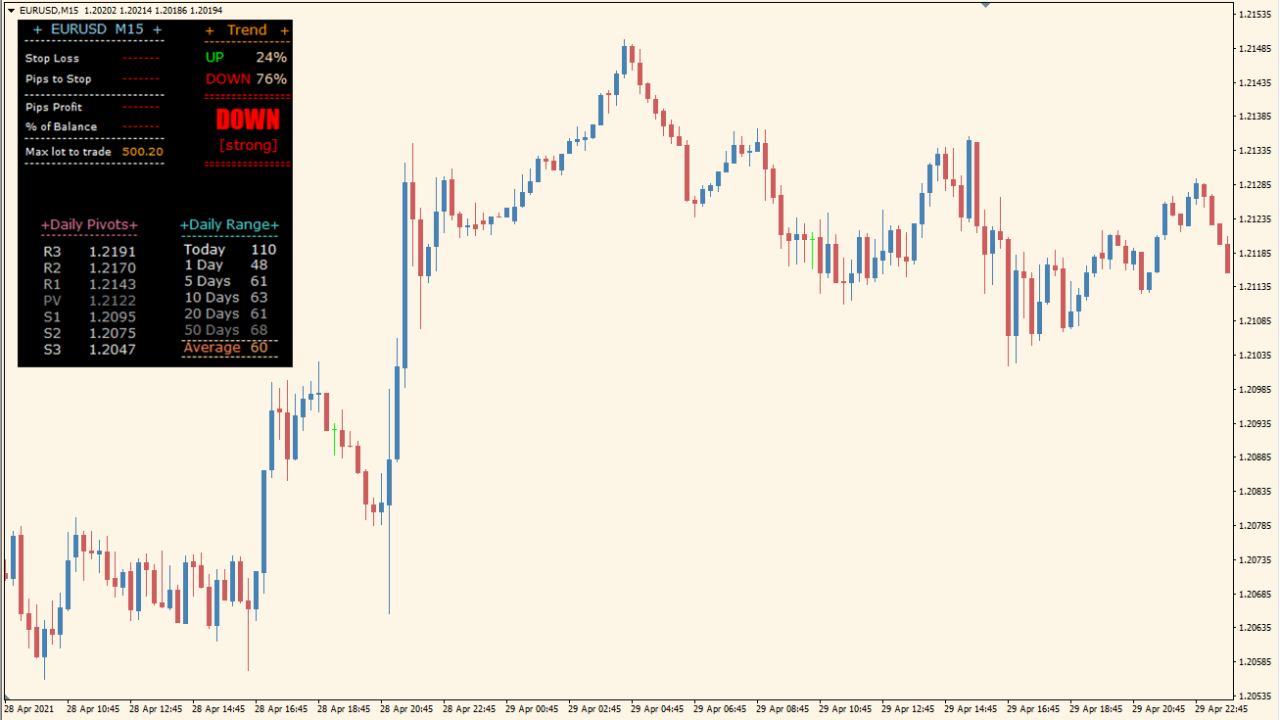
What is ferrufx-info-indicator?
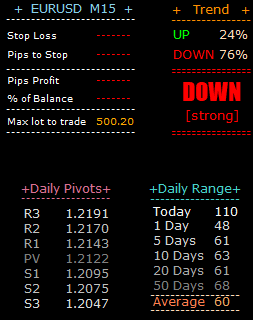
ferrufx-info-indicator is an MT4 dashboard that groups trend status, pivot references, range information, account details, and several oscillator readings on the chart. The panel can include moving-average status, CCI, MACD, ADX, Bull Power, Bear Power, Stochastic, RSI, Force Index, and Momentum values.
Separate display and position settings control which boxes and readings are visible. The dashboard collects chart information in one place for review; it does not turn those readings into a required decision.
How to Use It in Practice
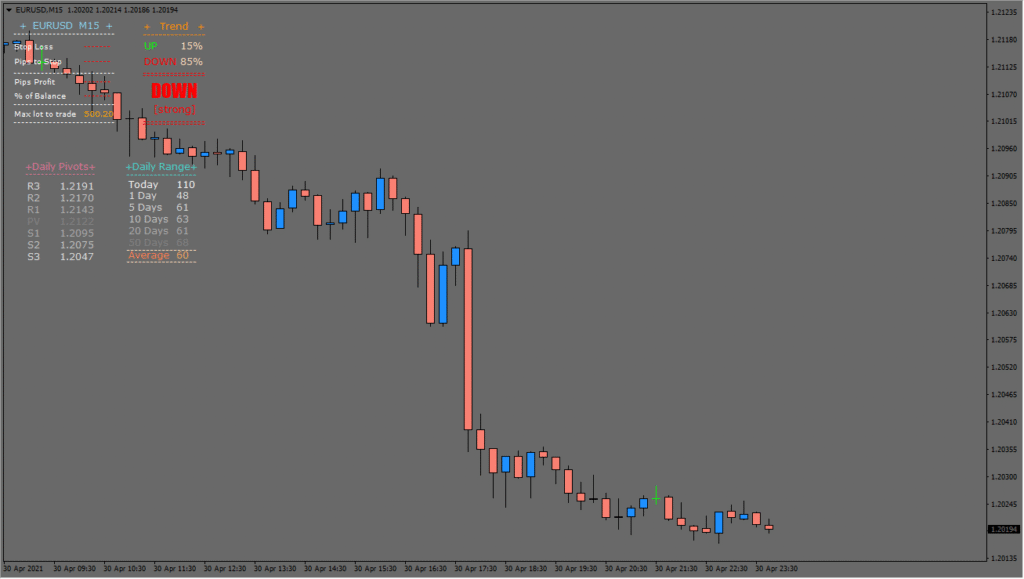
Use the dashboard as a compact visual reference:
- Add ferrufx-info-indicator to an MT4 chart and review the available dashboard boxes.
- Use the box and X/Y settings to show, hide, and position the trade-info, trend, pivot, and range sections.
- Enable the existing display options for the moving averages and oscillator readings you want to review.
- Use the leverage and pip-value fields only as displayed account and calculation context.
Several chart and account references are grouped in one panel, each section can be positioned or hidden, and individual indicator readings can be selected for a less crowded dashboard.
MT4 Indicator Parameters
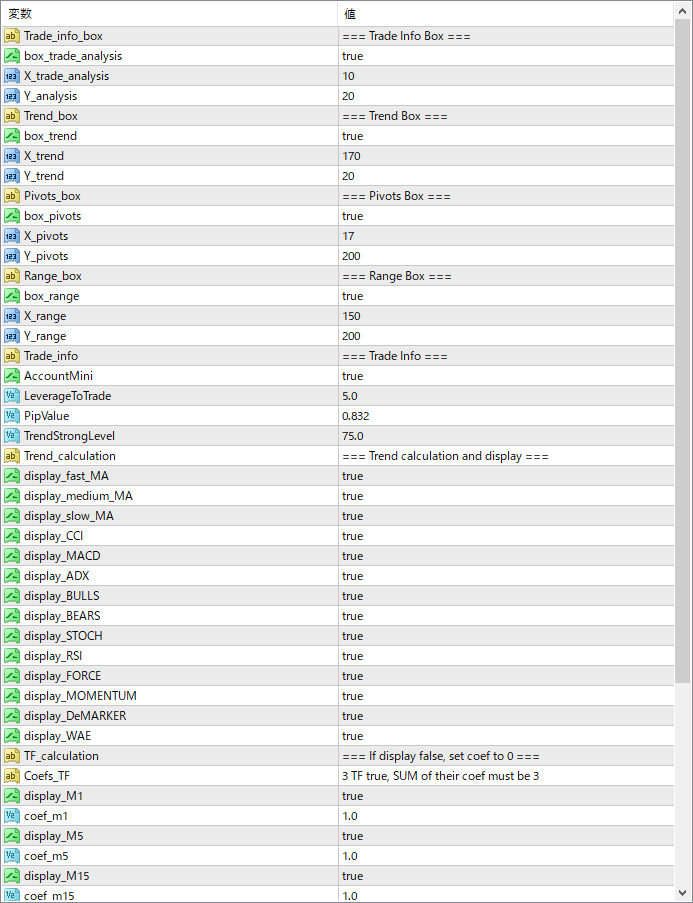
The screenshot above shows the default input parameters in the MT4 settings window.
| Parameter | Description |
|---|---|
| box_trade_analysis | Shows or hides the “Trade Info Box” which contains leverage and pip value details. |
| X_trade_analysis | Horizontal position of the Trade Info Box on the chart. |
| Y_analysis | Vertical position of the Trade Info Box on the chart. |
| box_trend | Enables or disables the display of the Trend Box section. |
| X_trend | Horizontal offset for positioning the Trend Box. |
| Y_trend | Vertical offset for the Trend Box. |
| box_pivots | Toggles the Pivots Box visibility. |
| X_pivots | Sets the horizontal position of the Pivots Box. |
| Y_pivots | Sets the vertical position of the Pivots Box. |
| box_range | Shows or hides the Range Box which displays volatility/range information. |
| X_range | Horizontal location of the Range Box. |
| Y_range | Vertical location of the Range Box. |
| AccountMini | Shows basic account info like leverage, pip value, etc. |
| LeverageToTrade | Sets the leverage used for position size calculation. |
| PipValue | Manually defines the pip value used in risk calculation. |
| TrendStrongLevel | Threshold level used to define strong trends for display. |
| display_fast_MA | Displays the fast moving average status in the trend section. |
| display_medium_MA | Displays the medium moving average status. |
| display_slow_MA | Displays the slow moving average status. |
| display_CCI | Enables the CCI indicator in the trend evaluation. |
| display_MACD | Includes MACD data in the dashboard. |
| display_ADX | Displays ADX trend strength values. |
| display_BULLS | Shows Bull Power values. |
| display_BEARS | Shows Bear Power values. |
| display_STOCH | Enables Stochastic Oscillator readings. |
| display_RSI | Displays the RSI reading. |
| display_FORCE | Includes Force Index data. |
| display_MOMENTUM | Shows the Momentum indicator value. |


