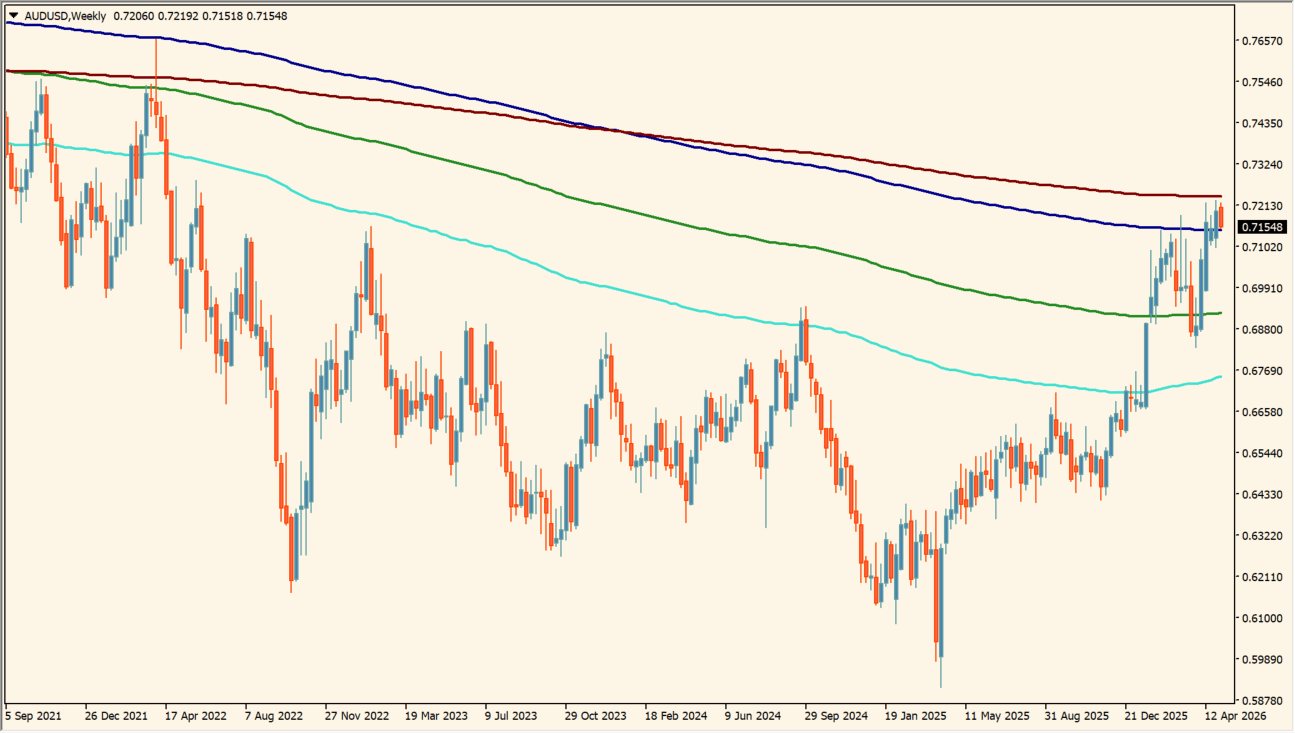
What is Fibonacci-based Moving Averages Part 2?
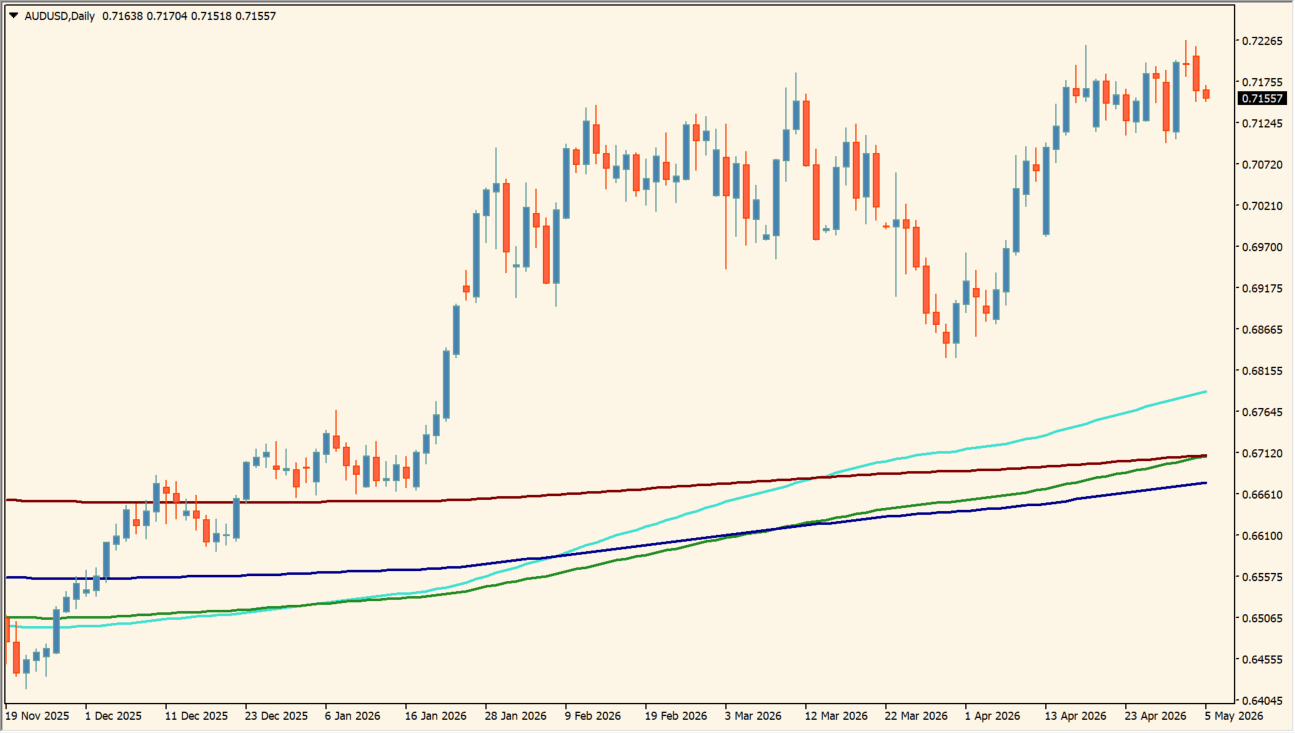
Fibonacci-based Moving Averages Part 2 overlays five moving averages with Fibonacci-derived periods. The 233, 377, 610, 987, and 1598-period lines are shown together so that longer-scale line placement can be compared on one chart.
Its default periods are deliberately long. The display is designed for reviewing the position and ordering of several moving averages rather than reducing them to one line.
How to use Fibonacci-based Moving Averages Part 2
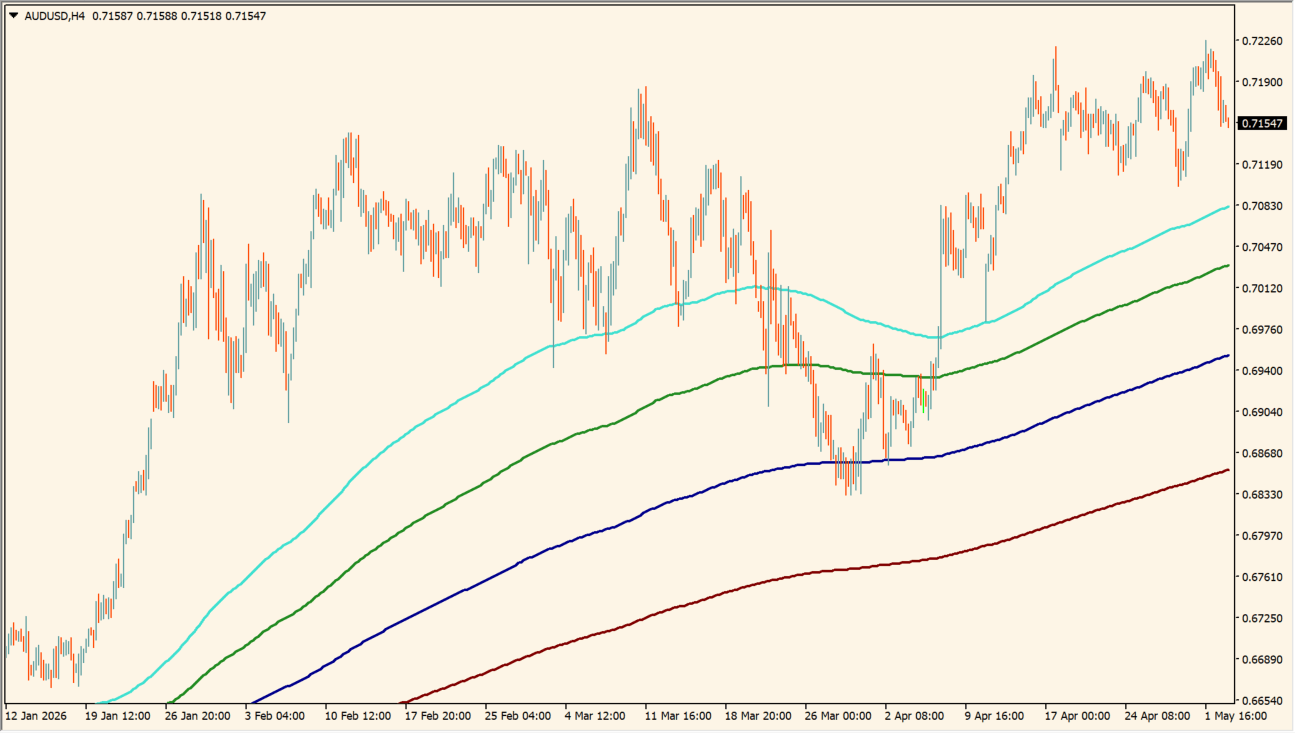
Review the five lines together with price and with one another. Check whether candles are above or below the group and whether the lines retain a consistent ordering, particularly when comparing longer chart timeframes.
FastMAPeriod1 through FastMAPeriod5 set the five displayed periods. Changing any of these inputs changes the corresponding moving-average line and the spacing of the group.
Where it helps
All five Fibonacci-derived periods remain visible together.
The group makes the relative order of the moving averages easy to review.
Each displayed average has its own input.
MT4 Indicator Parameters
The table below lists the available MT4 indicator parameters. You can customize these options in the MetaTrader Inputs dialog to match your trading preferences.
| Parameter | Description |
|---|---|
| FastMAPeriod1 | Sets the first moving-average period. |
| FastMAPeriod2 | Sets the second moving-average period. |
| FastMAPeriod3 | Sets the third moving-average period. |
| FastMAPeriod4 | Sets the fourth moving-average period. |
| FastMAPeriod5 | Sets the fifth moving-average period. |
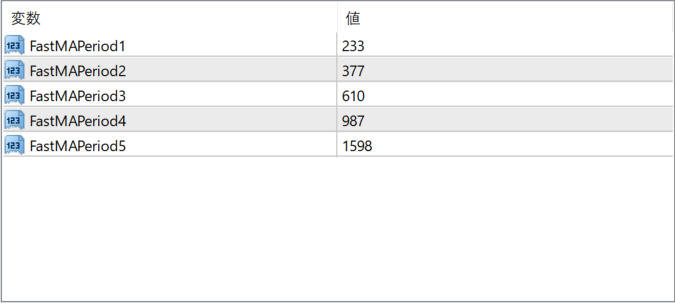
The screenshot above shows the default input parameters in the MT4 settings window.
How to Install .ex4 Indicator in MetaTrader 4
- Download the ZIP file and extract it.
- In MT4, select File → Open Data Folder.
- Open MQL4 → Indicators and copy the EX4 or MQ4 file into it.
- If the package includes library files, copy them to MQL4 → Libraries. Copy TPL files to the top-level templates folder.
- Restart MT4, find the indicator in the Navigator, and drag it onto a chart.
Test the tool on a demo account first. File contents and required folders can vary between packages.


