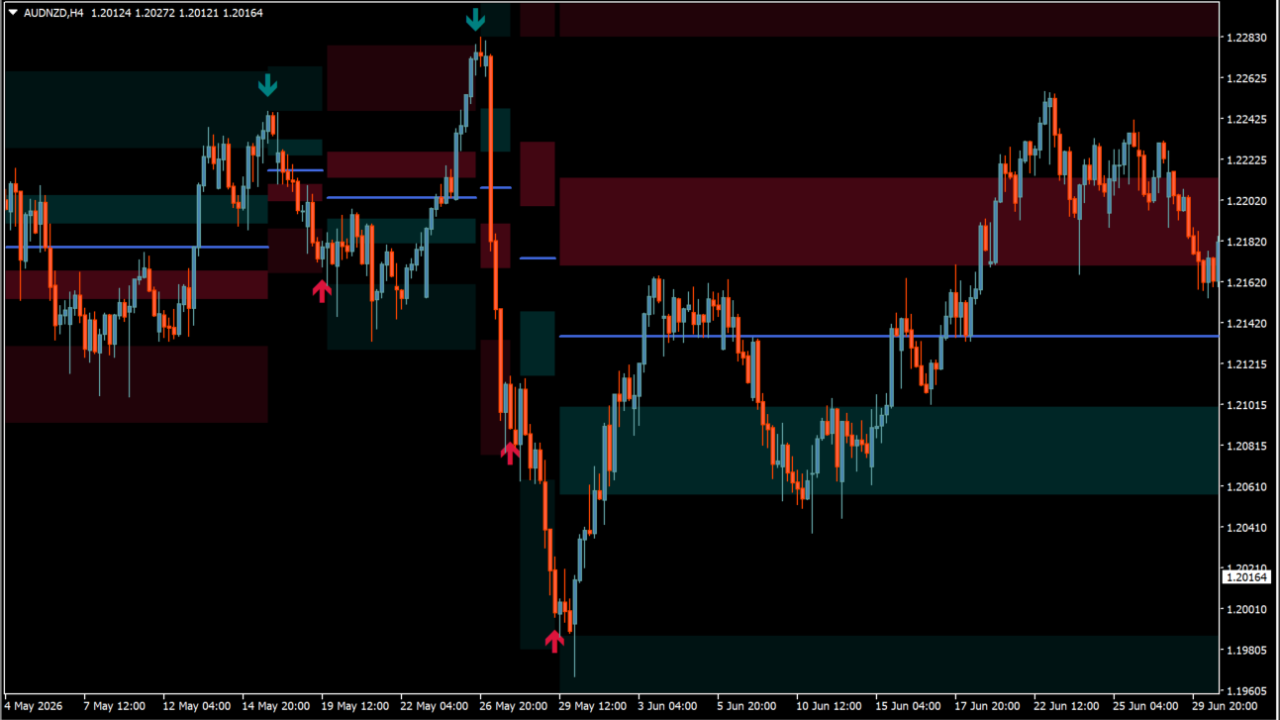
What is Fibonacci Ranges (Real-Time)?
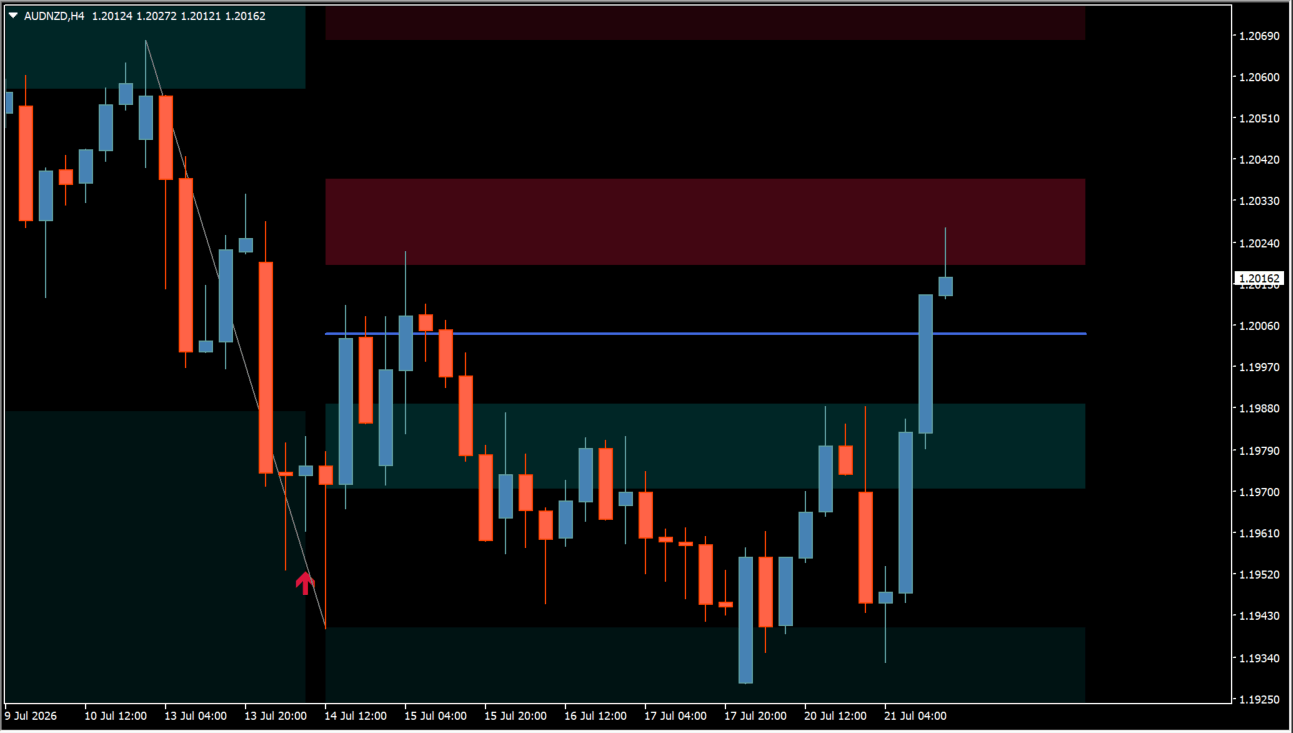
Fibonacci Ranges (Real-Time) is an MT4 indicator that detects recent swing highs and lows and automatically draws Fibonacci range zones and a central line. Teal and red zones show the displayed support and resistance areas, while the blue Fm line marks the middle level.
How to use Fibonacci Ranges (Real-Time)
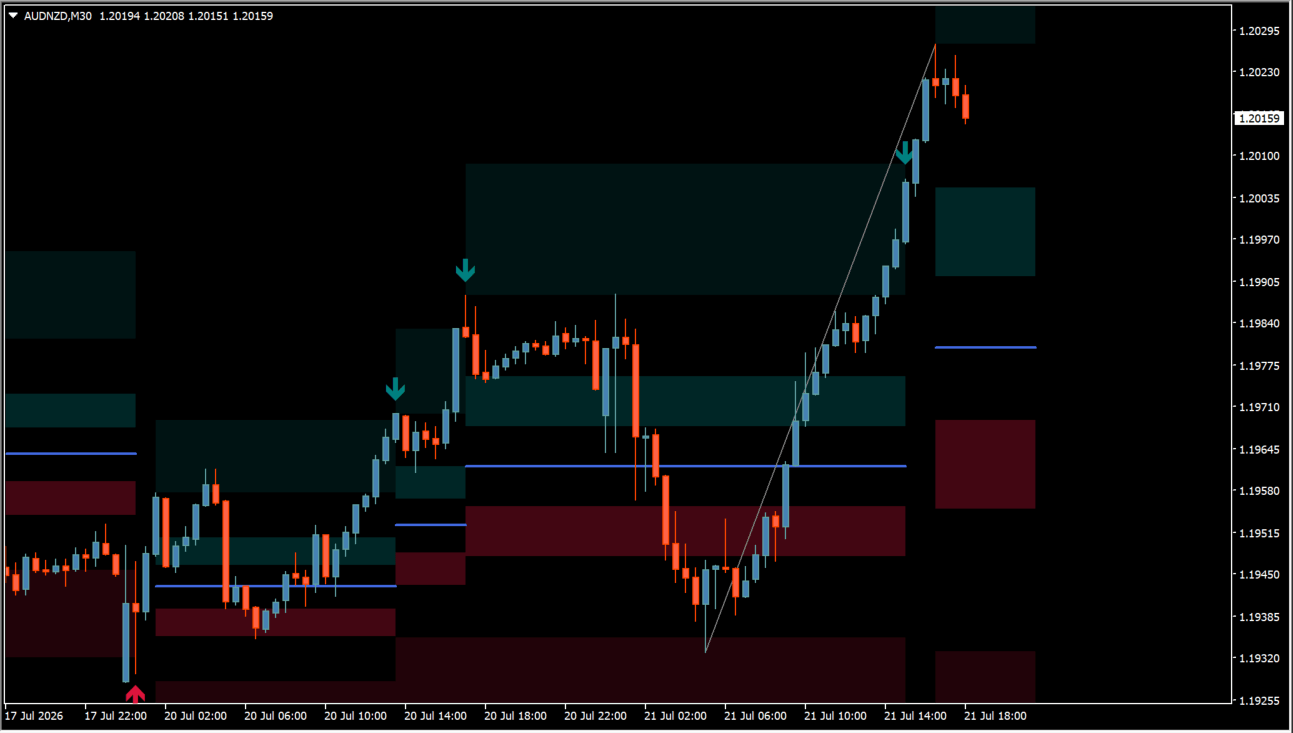
Break arrows appear when price breaks a specified Fibonacci level. Read an arrow only after checking trend direction and price position in the Fibonacci zones; a zone boundary can also provide the displayed target or stop reference.
Where it helps
MT4 Indicator Parameters
The table below lists the available MT4 indicator parameters. You can customize these options in the MetaTrader Inputs dialog to match your trading preferences.
| Parameter | Description |
|---|---|
| Swing Settings ######################### | Configuration group. |
| L | Sets the number of candles on the left used to identify a swing. Default: 5. |
| R | Sets the number of candles on the right used to identify a swing. Default: 1. |
| Fibonacci Channel ######################### | Configuration group. |
| Channel | Selects the Fibonacci channel display format. Default: Channel Shadows. |
| Break level | Sets the Fibonacci level range used for break detection. Default: 0.000 - 1.000. |
| Break count | Sets the count used for break detection. Default: 2. |
| Show breaks | Controls whether break arrows or markers are shown. Default: true. |
| Fibonacci ######################### | Configuration group. |
| Latest Fibonacci | Controls whether only the latest Fibonacci range is displayed. Default: false. |
| F0 | Sets the display color for the lower Fibonacci level area. Default: Teal. |
| F_ | Sets the display color for the lower-side Fibonacci zone. Default: Teal. |
| Fm | Sets the display color for the Fibonacci middle line. Default: RoyalBlue. |
| Fp | Sets the display color for the upper-side Fibonacci zone. Default: Crimson. |
| F1 | Sets the display color for the upper Fibonacci level area. Default: Crimson. |
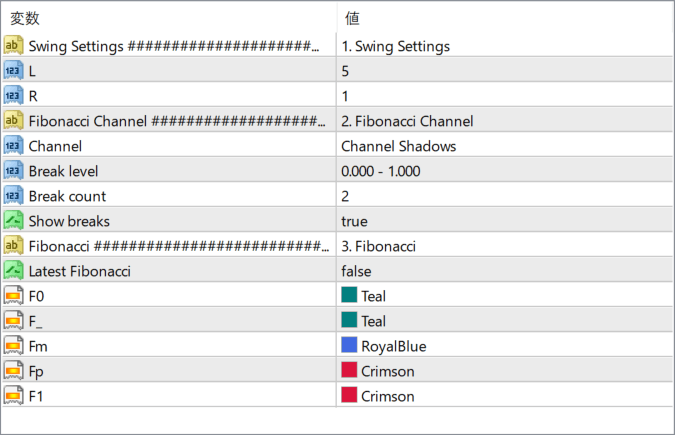
The screenshot above shows the default input parameters in the MT4 settings window.
How to Install .ex4 Indicator in MetaTrader 4
- Download the ZIP file and extract it.
- In MT4, select File → Open Data Folder.
- Open MQL4 → Indicators and copy the EX4 or MQ4 file into it.
- If the package includes library files, copy them to MQL4 → Libraries. Copy TPL files to the top-level templates folder.
- Restart MT4, find the indicator in the Navigator, and drag it onto a chart.
Test the tool on a demo account first. File contents and required folders can vary between packages.


