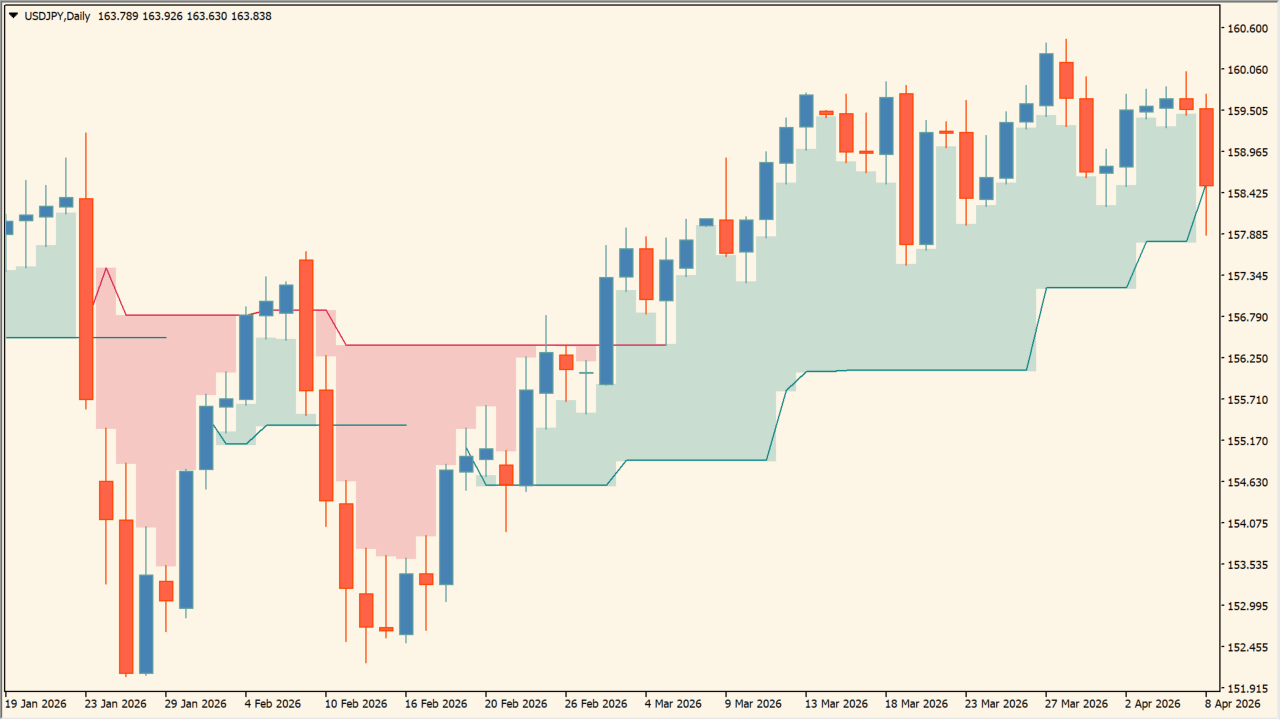
What is FVG Positioning Average?
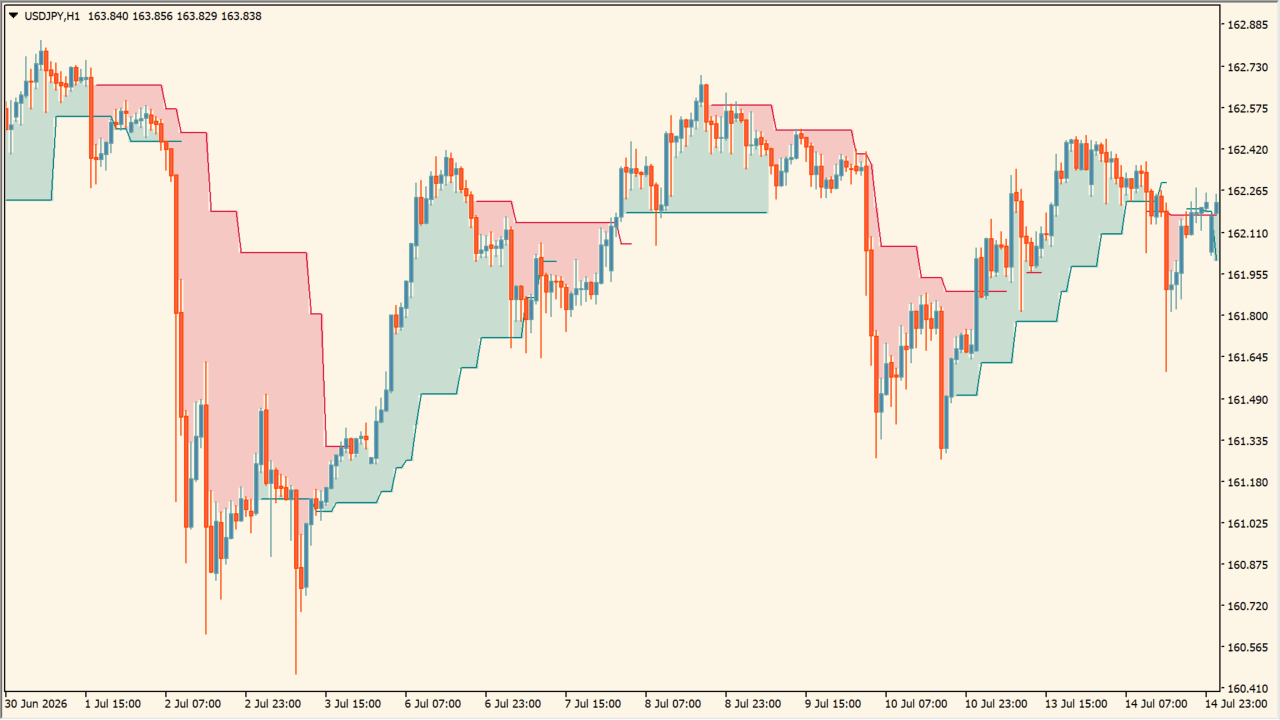
FVG Positioning Average is an MT4 indicator that uses Fair Value Gaps to color the candle background with graded areas, teal-toned during an upward-side bias and crimson-toned during a downward-side bias, together with their stepped boundaries.
The display is intended to make the current price position relative to the calculated FVG context easier to distinguish, keeping the colored areas and candle position visible without replacing the chart candles.
How to use FVG Positioning Average
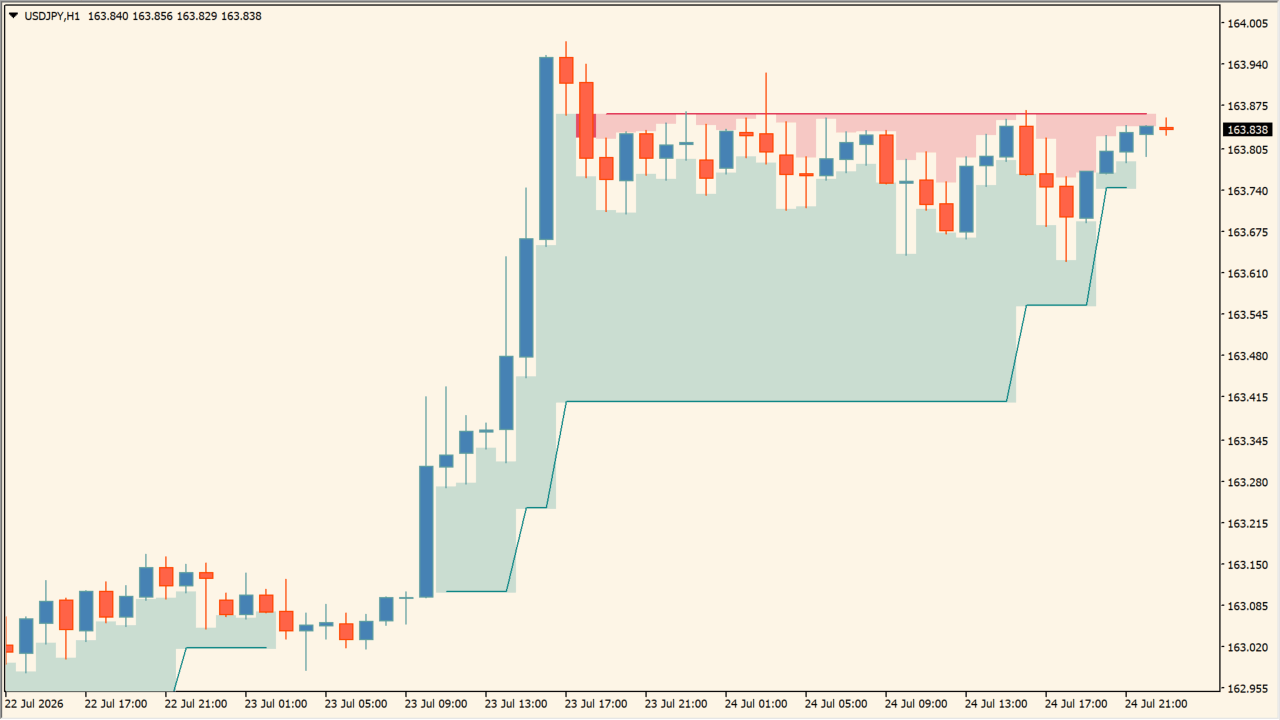
Compare the gradient background with the candle position:
Where it helps
Teal and crimson areas use separate colors for upward and downward bias, the display includes stepped boundaries around the colored areas, and Lookback and ATR controls alter the calculated display.
MT4 Indicator Parameters
The table below lists the available MT4 indicator parameters. You can customize these options in the MetaTrader Inputs dialog to match your trading preferences.
| Parameter | Description |
|---|---|
| Settings | Indicator settings section. |
| FVG Lookback | Sets the FVG lookback length. Default: 30. |
| Lookback Type | Selects the lookback calculation type. Default: Bar Count. |
| ATR Multiplier | Sets the ATR-based size filter. Default: 0.25. |
| Style | Display-style settings section. |
| Show FVGs on Chart | Shows or hides FVGs on the chart. Default: true. |
| Bullish Color | Sets the bullish-area color. Default: Teal. |
| Bearish Color | Sets the bearish-area color. Default: Crimson. |
| Show Gradient Areas | Shows or hides the graded background areas. Default: true. |
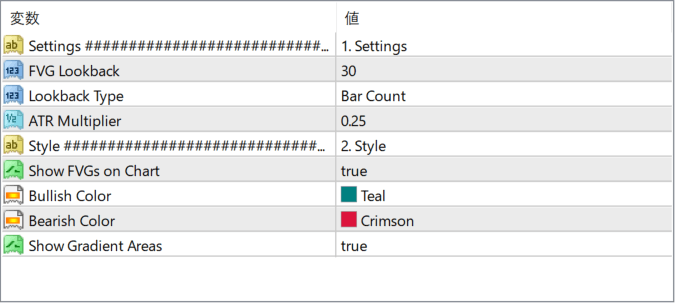
The screenshot above shows the default input parameters in the MT4 settings window.
How to Install .ex4 Indicator in MetaTrader 4
- Download the ZIP file and extract it.
- In MT4, select File → Open Data Folder.
- Open MQL4 → Indicators and copy the EX4 or MQ4 file into it.
- If the package includes library files, copy them to MQL4 → Libraries. Copy TPL files to the top-level templates folder.
- Restart MT4, find the indicator in the Navigator, and drag it onto a chart.
Test the tool on a demo account first. File contents and required folders can vary between packages.


