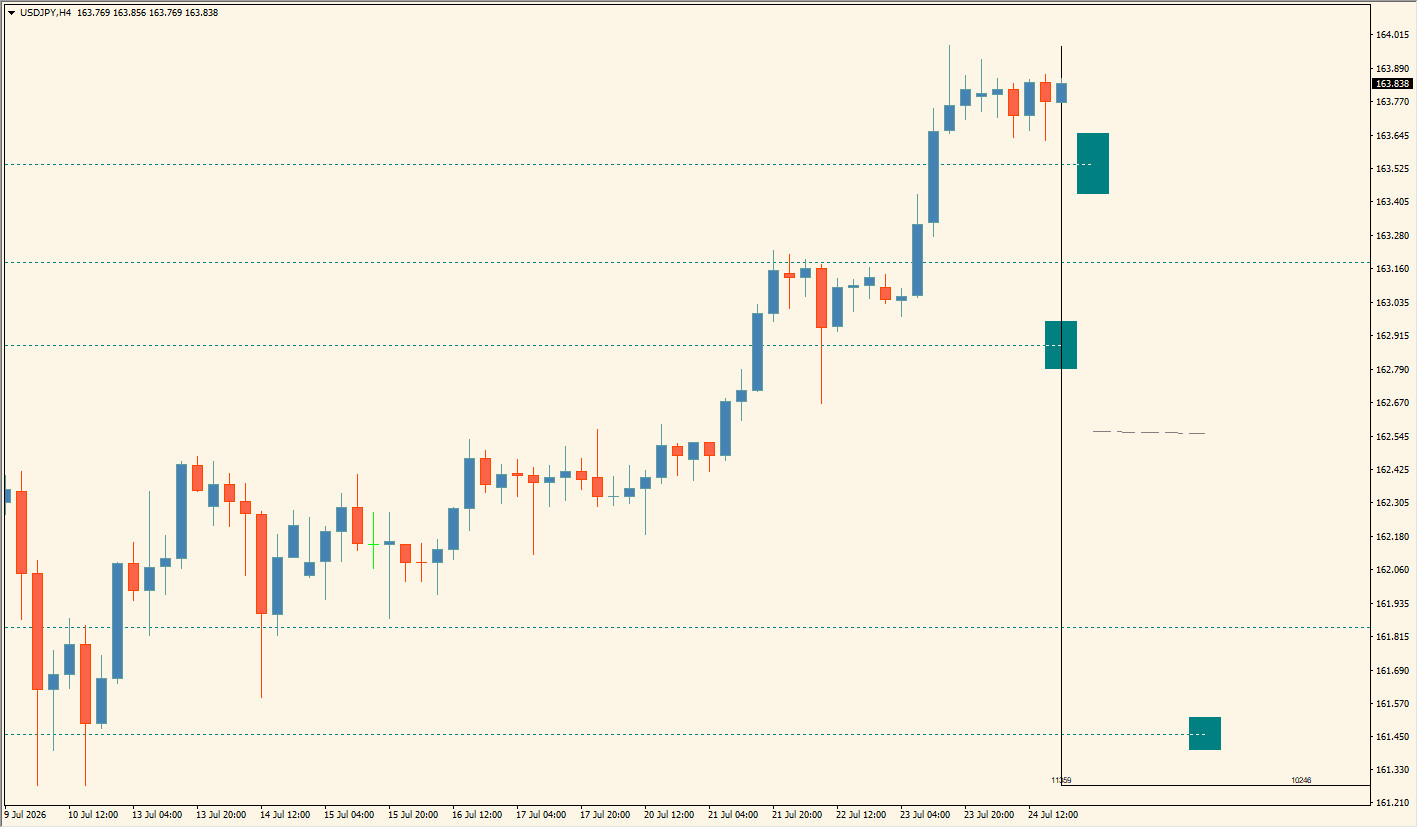
What is FVG Price & Volume Graph?
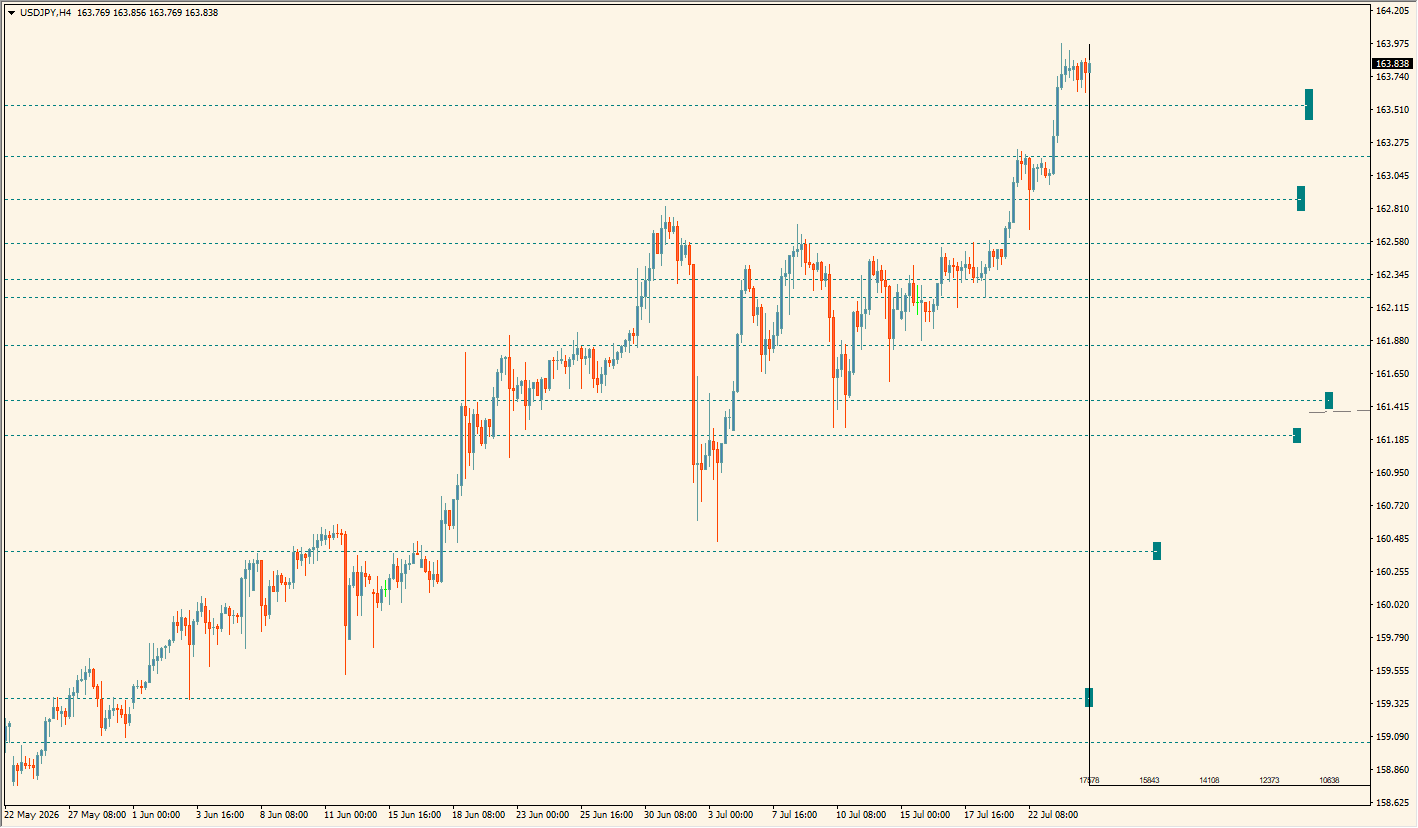
FVG Price & Volume Graph is an MT4 indicator that detects Fair Value Gaps (FVGs), marks their price ranges with colored blocks, and plots a right-side graph for their volume context.
FVG ranges can also be shown across more than one timeframe, keeping the drawn areas, horizontal references, and the right-side graph available in the same chart view.
How to use FVG Price & Volume Graph
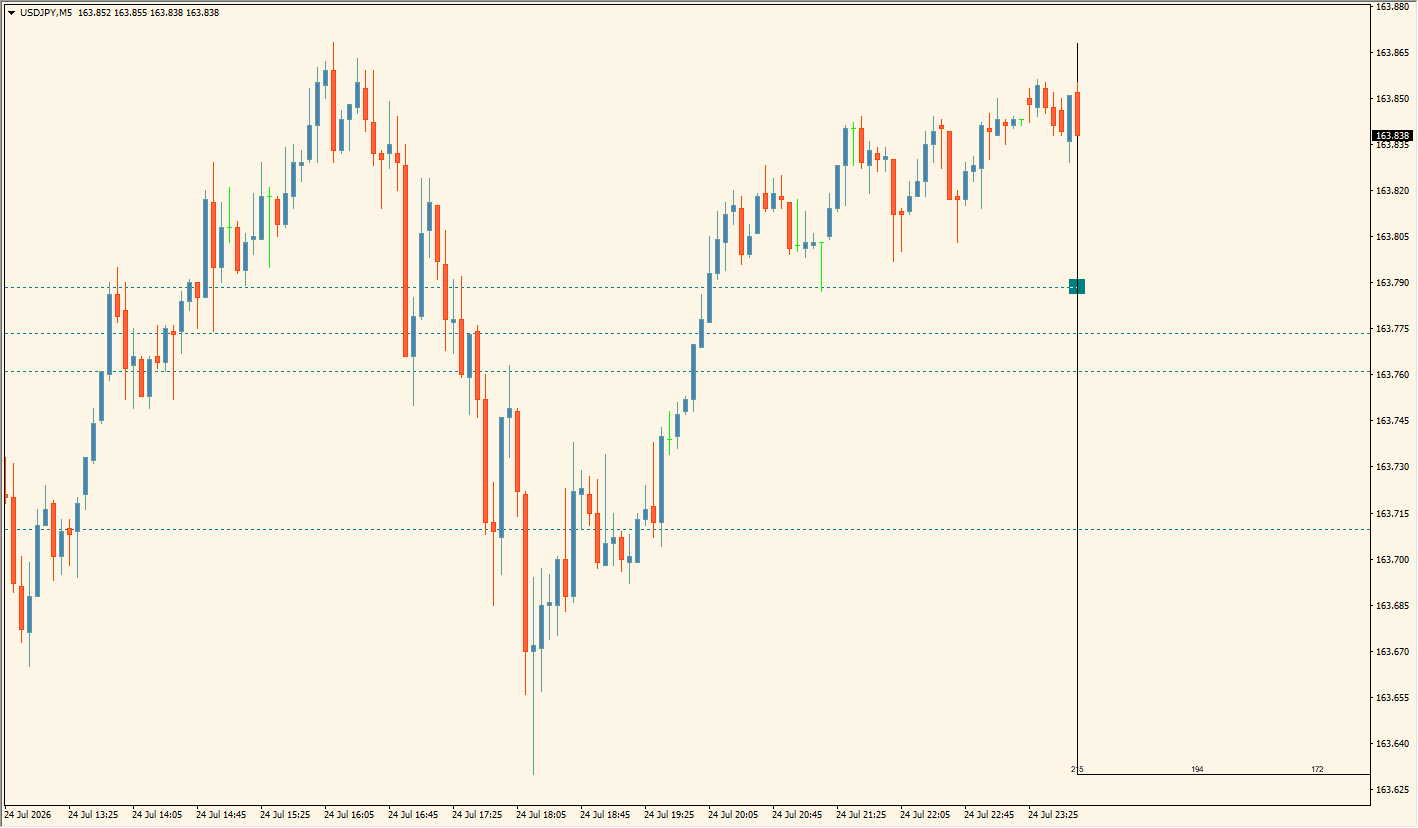
Compare the marked FVG ranges with the right-side volume graph:
Where it helps
The right-side graph is displayed alongside each marked FVG range, visible-range and mitigation controls refine which FVGs remain on the chart, and axis, label, gradient, and resolution inputs control the graph display.
MT4 Indicator Parameters
The table below lists the available MT4 indicator parameters. You can customize these options in the MetaTrader Inputs dialog to match your trading preferences.
| Parameter | Description |
|---|---|
| Display Amount | Sets the number of FVGs displayed. Default: 100. |
| Highest Volume Averages | Configures the volume-average display. Default: 3. |
| Consider Mitigation | Controls whether FVG mitigation is considered. Default: true. |
| Filter FVGs Outside Visible Range | Filters FVGs outside the visible chart range. |
| Intrabar Data TF | Sets the timeframe used for volume calculations. Default: 1 Minute. |
| Bullish FVG | Sets the display color for bullish FVGs. |
| Bearish FVG | Sets the display color for bearish FVGs. |
| Bullish Highest Volume Levels | Sets the display color for bullish high-volume levels. |
| Bearish Highest Volume Levels | Sets the display color for bearish high-volume levels. |
| Regression Line | Shows or hides the regression line. Default: true. |
| Regression Line Color | Sets the regression-line color. |
| Gradient | Controls gradient display. Default: None. |
| Minimum Gradient Transparency | Sets the gradient transparency. |
| Show Axes | Shows or hides graph axes. |
| Show X Axis Labels | Shows or hides x-axis labels. |
| X Axis Label Frequency | Sets the interval between x-axis labels. |
| Graph Resolution | Sets the graph rendering resolution. Default: 150. |
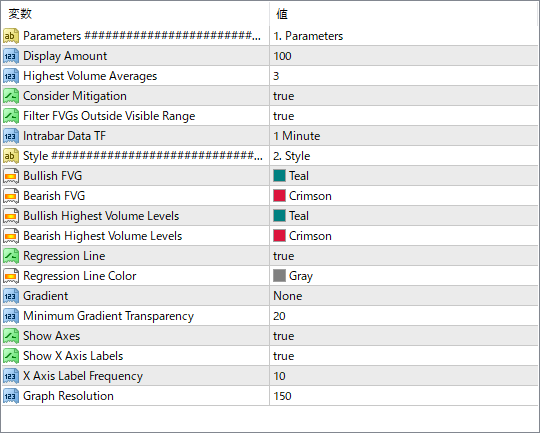
The screenshot above shows the default input parameters in the MT4 settings window.
How to Install .ex4 Indicator in MetaTrader 4
- Download the ZIP file and extract it.
- In MT4, select File → Open Data Folder.
- Open MQL4 → Indicators and copy the EX4 or MQ4 file into it.
- If the package includes library files, copy them to MQL4 → Libraries. Copy TPL files to the top-level templates folder.
- Restart MT4, find the indicator in the Navigator, and drag it onto a chart.
Test the tool on a demo account first. File contents and required folders can vary between packages.


