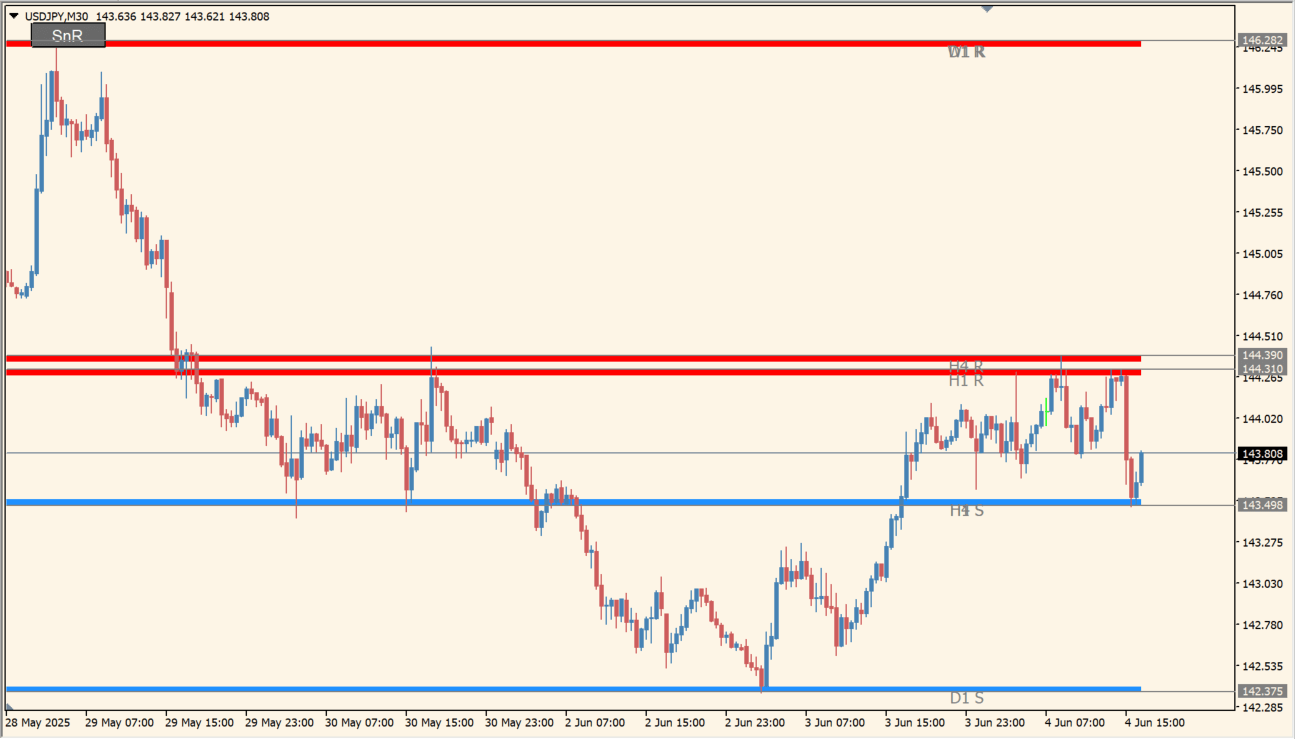
What is Givonly_SnR_SnD_r2 BT?
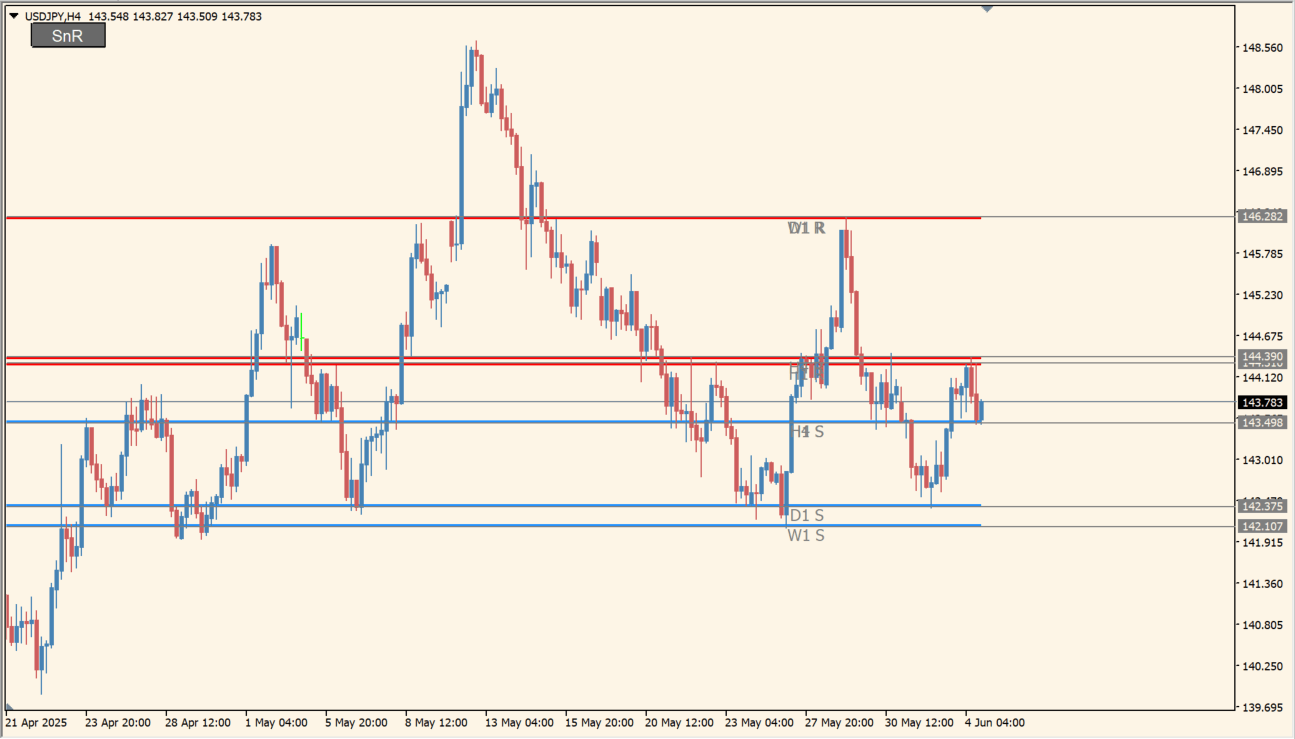
Givonly_SnR_SnD_r2 BT draws thick red resistance and blue support lines from higher-timeframe data. H1, H4, daily, and weekly levels can be missed on a lower intraday chart.
The purpose is to keep broader reaction areas visible while reviewing a short-term setup. A line remains a reference zone and should be compared with the current price structure.
How to use Givonly_SnR_SnD_r2 BT
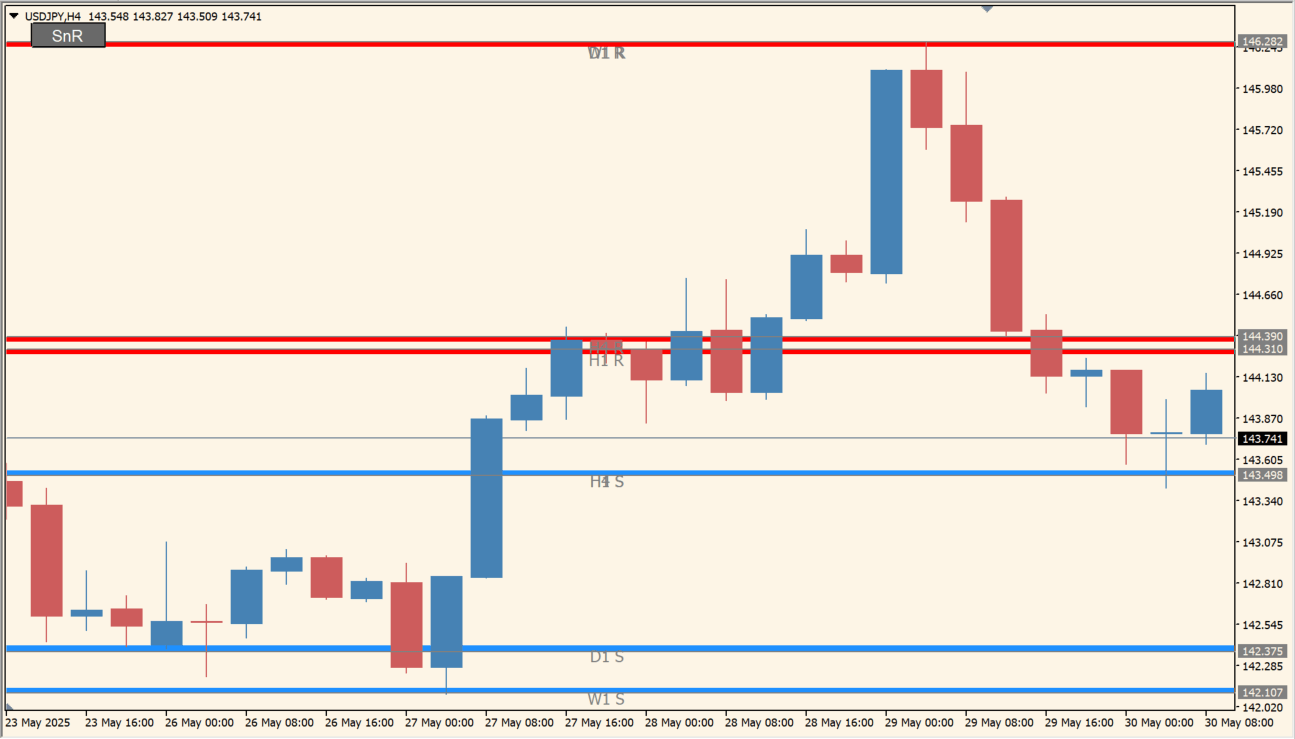
Add Givonly_SnR_SnD_r2 BT to an MT4 chart and inspect the higher-timeframe red and blue lines around the current candles.
Use the timeframe, line width, color, and label settings to focus the display on the higher-timeframe zones relevant to your chart.
Where it helps
Keeps H1, H4, daily, and weekly context visible on a lower chart.
Uses red for resistance and blue for support to separate the two roles.
Helps prevent lower-timeframe review from ignoring broader reaction areas.
MT4 Indicator Parameters
The table below lists the available MT4 indicator parameters. You can customize these options in the MetaTrader Inputs dialog to match your trading preferences.
| Parameter | Description |
|---|---|
| SHOW_H1 | Enables or disables this display option. Default: true. |
| SHOW_H4 | Enables or disables this display option. Default: true. |
| SHOW_D1 | Enables or disables this display option. Default: true. |
| SHOW_W1 | Enables or disables this display option. Default: true. |
| Supply_Demand_Area | Controls this indicator option. Default: 35. |
| SupportColor | Sets the display color for this option. Default: clrDodgerBlue. |
| ResistanceColor | Sets the display color for this option. Default: clrRed. |
| P60R | Controls this indicator option. Default: clrGray. |
| P60S | Controls this indicator option. Default: clrGray. |
| P240R | Controls this indicator option. Default: clrGray. |
| P240S | Controls this indicator option. Default: clrGray. |
| P1440R | Controls this indicator option. Default: clrGray. |
| P1440S | Controls this indicator option. Default: clrGray. |
| P10080R | Controls this indicator option. Default: clrGray. |
| P10080S | Controls this indicator option. Default: clrGray. |
| button_note1 | Settings section. |
| btn_corner | Sets this calculation or display option. Default: CORNER_LEFT_UPPER. |
| btn_text | Controls this indicator option. Default: "SnR". |
| btn_Font | Sets the display width or text size. Default: "Arial". |
| btn_FontSize | Sets the display width or text size. Default: 10. |
| btn_text_ON_color | Sets the display color for this option. Default: clrWhite. |
| btn_text_OFF_color | Sets the display color for this option. Default: clrRed. |
| btn_background_color | Sets the display color for this option. Default: clrDimGray. |
| btn_border_color | Sets the display color for this option. Default: clrBlack. |
| button_x | Controls this indicator option. Default: 20. |
| button_y | Controls this indicator option. Default: 13. |
| btn_Width | Sets the display width or text size. Default: 60. |
| btn_Height | Controls this indicator option. Default: 20. |
| button_note2 | Settings section. |
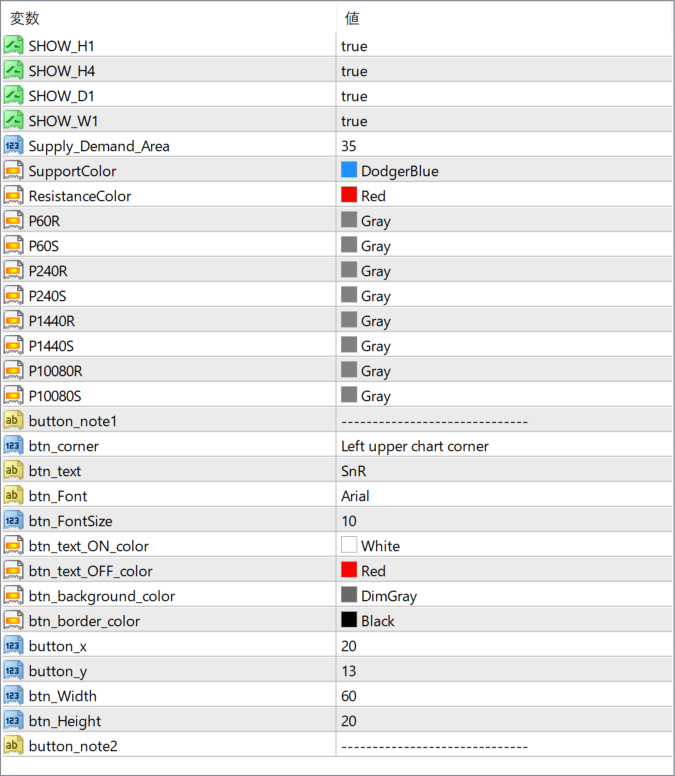
The screenshot above shows the default input parameters in the MT4 settings window.
How to Install .ex4 Indicator in MetaTrader 4
- Download the ZIP file and extract it.
- In MT4, select File → Open Data Folder.
- Open MQL4 → Indicators and copy the EX4 or MQ4 file into it.
- If the package includes library files, copy them to MQL4 → Libraries. Copy TPL files to the top-level templates folder.
- Restart MT4, find the indicator in the Navigator, and drag it onto a chart.
Test the tool on a demo account first. File contents and required folders can vary between packages.


