What is Givonly_SnR_SnD_r2 Indicator?
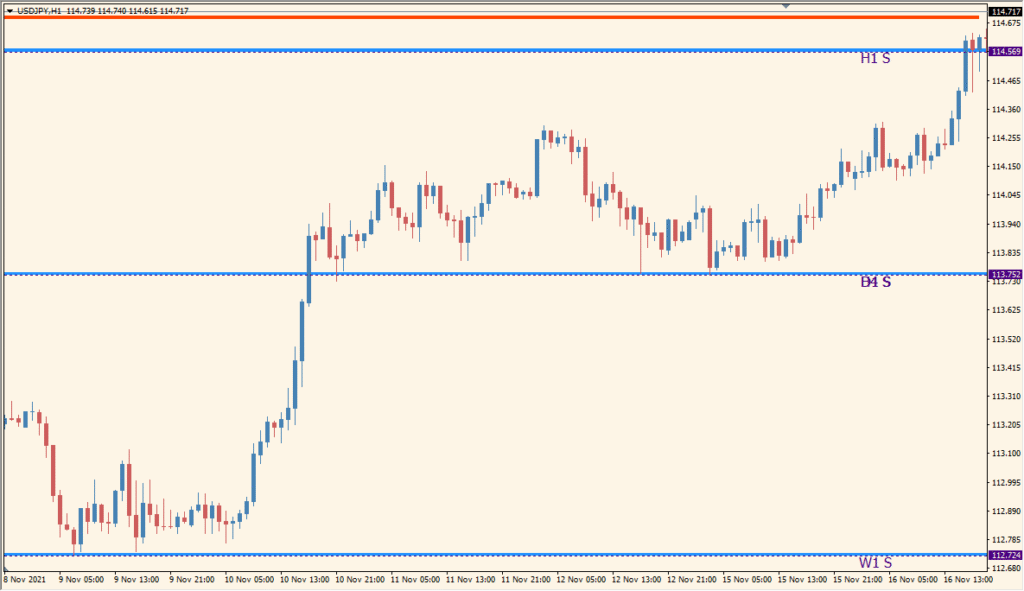
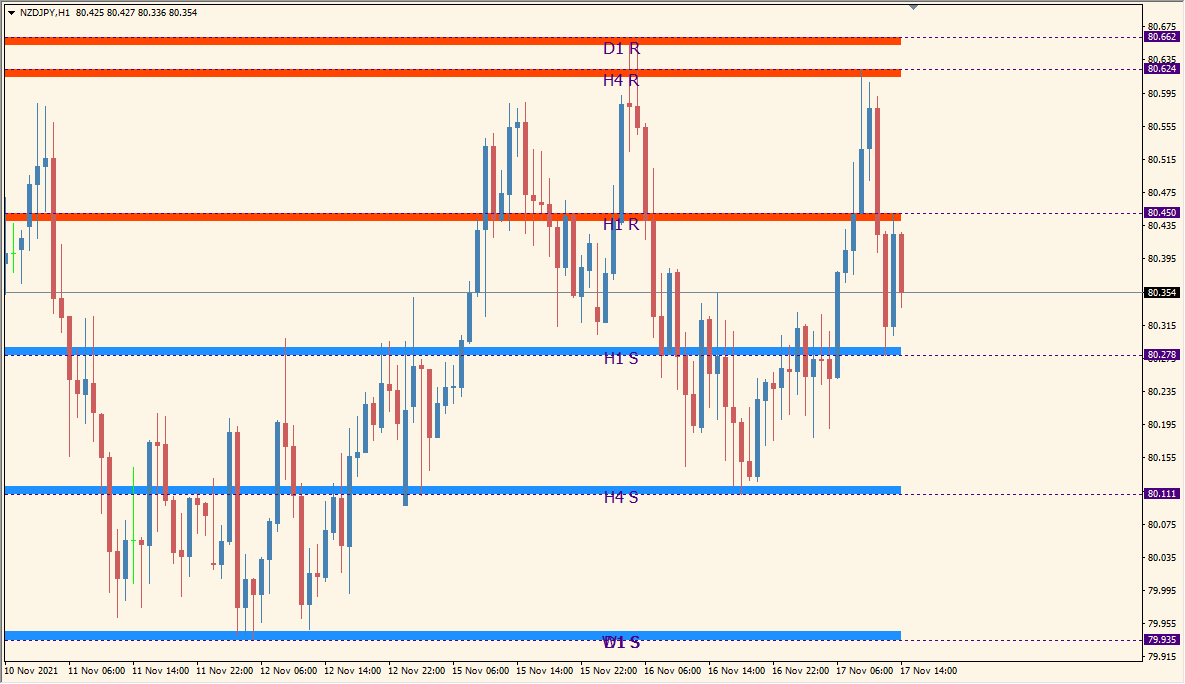
Givonly SnR SnD R2 for MT4 displays support, resistance, supply, and demand references from several timeframes. H1, H4, D1, and W1 visibility options let the chart show the level groups relevant to the current review.
Supply_Demand_Area controls the number of historical zones, while the existing color, line, label, and timeframe settings shape the presentation. The overlay keeps broader level context visible on a lower-timeframe chart.
How to Use It in Practice
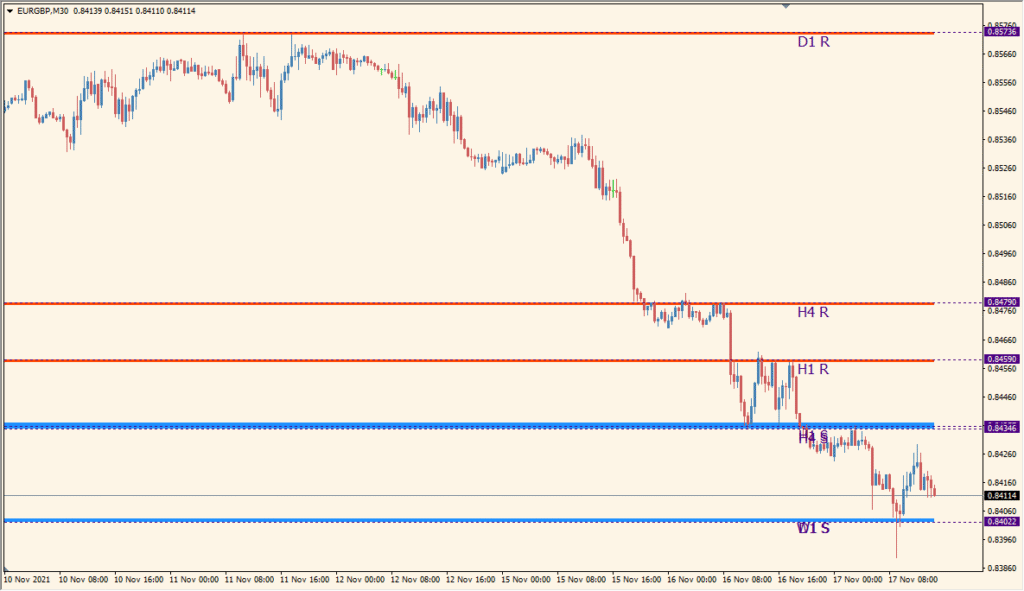
Givonly SnR SnD R2 draws blue support lines and red resistance lines from H1, H4, D1, and W1 on the same chart.
- Separate the blue and red horizontal groups by their source timeframe before comparing them with the lower-timeframe candles.
- Set the relevant SHOW_… option to false to hide an unwanted H1, H4, D1, or W1 group.
- Use Supply_Demand_Area to change the thickness of the displayed lines.
- The exact price basis for every line is unspecified, so observe the plotted groups on the selected symbol before relying on their placement.
Several timeframe groups are available in one overlay, the historical zone count is configurable, and colors and visibility options help distinguish the level families.
MT4 Indicator Parameters
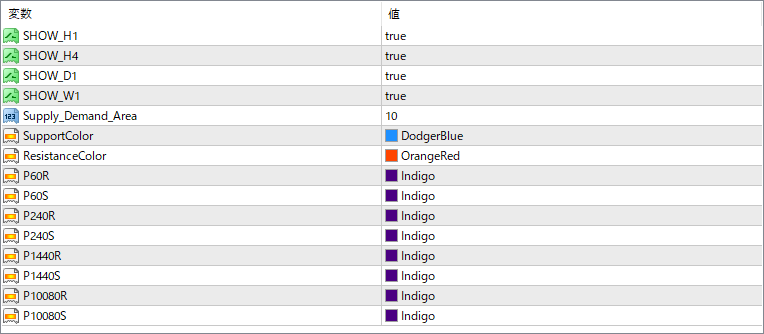
The screenshot above shows the default input parameters in the MT4 settings window.
| Parameter | Description |
|---|---|
| SHOW_H1 | Enables or disables the display of support and resistance zones from the H1 timeframe. |
| SHOW_H4 | Enables or disables the display of H4 supply and demand levels. |
| SHOW_D1 | Controls whether D1 timeframe levels are shown on the chart. |
| SHOW_W1 | Displays or hides the support and resistance lines from the W1 timeframe. |
| Supply_Demand_Area | Defines how many past zones are drawn. A higher value increases the number of visible historical levels. |
| SupportColor | Sets the color used to draw support zones on the chart. |
| ResistanceColor | Sets the color used to draw resistance zones on the chart. |
| P60R / P60S | Defines the color of resistance (R) or support (S) zones from the 60-minute period. |
| P240R / P240S | Sets the line colors for H4 resistance and support zones respectively. |
| P1440R / P1440S | Controls the colors for daily timeframe resistance and support zones. |
| P10080R / P10080S | Sets the line colors for weekly resistance and support zones. |


