What is Givonly_SnR_SnD_r2 Indicator?
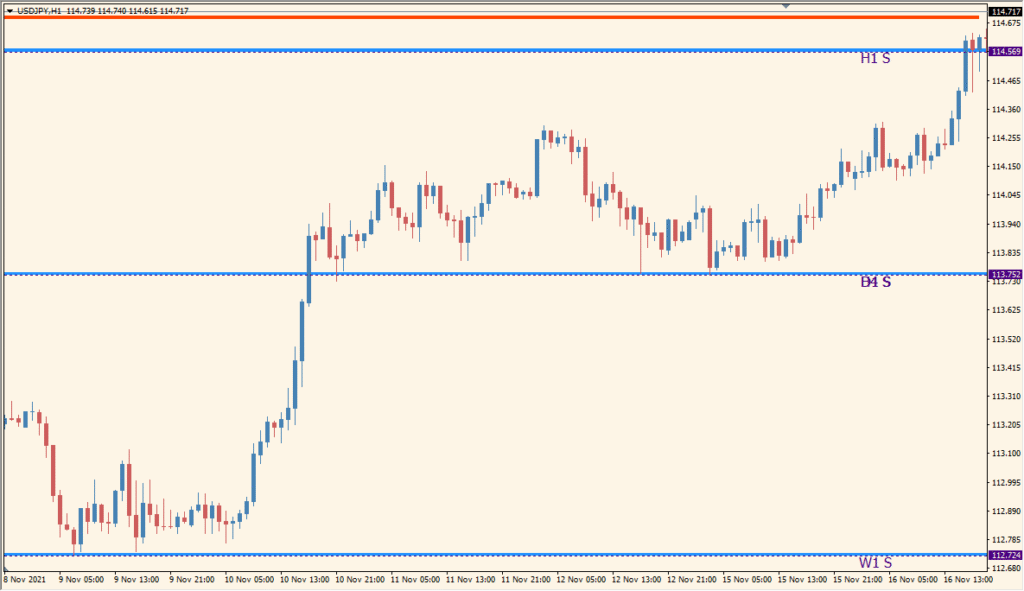
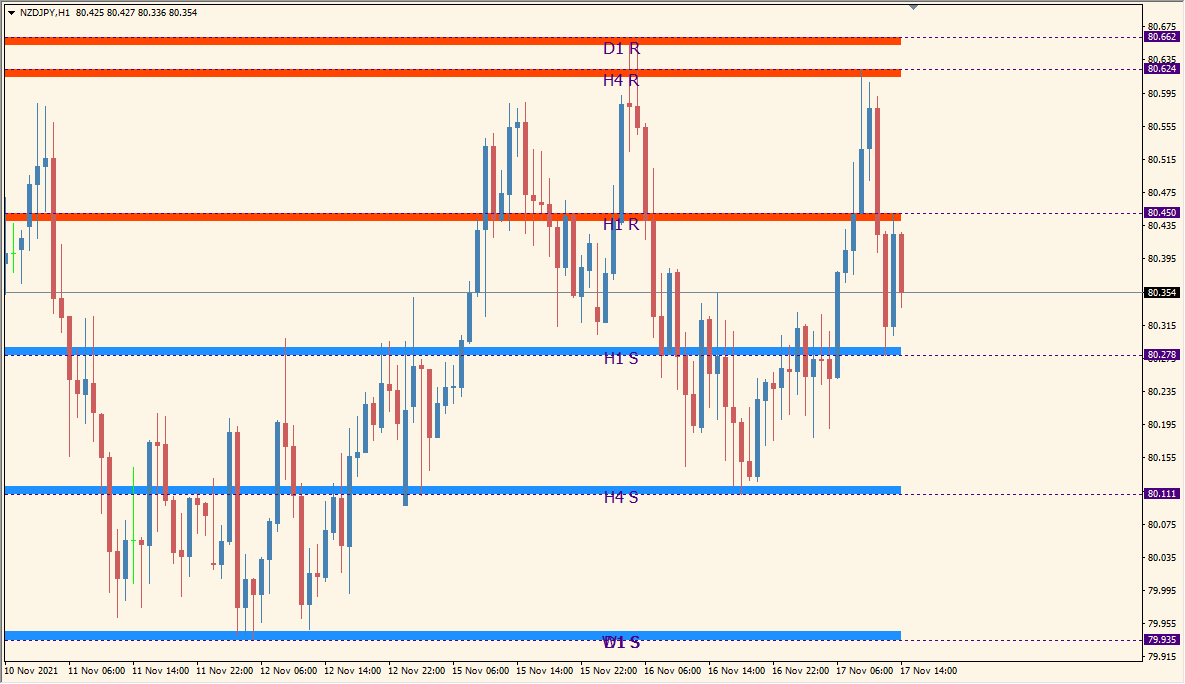
The Givonly_SnR_SnD_r2 indicator for MT4 highlights support and resistance zones based on supply and demand across multiple timeframes. It visually marks these levels with colored horizontal lines and labels, helping traders quickly identify key zones where price reactions are likely to occur.
This tool is useful for traders who rely on price action, especially those looking for potential reversal or breakout areas. By showing S&R levels from higher timeframes, it provides better context for decisions made on lower timeframes.
How to Use It in Practice
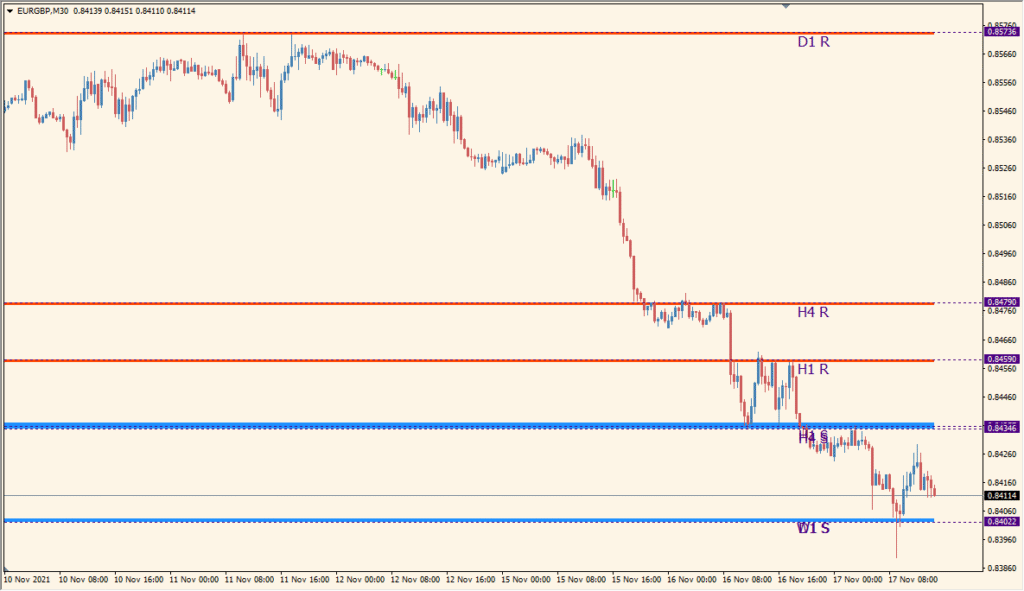
In live trading, the Givonly_SnR_SnD_r2 indicator can help you:
- Identify key supply and demand zones that might cause reversals.
- Use multi-timeframe levels to avoid trading into higher timeframe support or resistance.
- Improve entry timing by combining lower timeframe patterns with higher timeframe S&R zones.
- Quickly visualize where price may react or consolidate.
The indicator’s visual clarity makes it suitable for scalpers, day traders, and swing traders alike.
Best Settings & MT4 Parameters for Givonly_SnR_SnD_r2
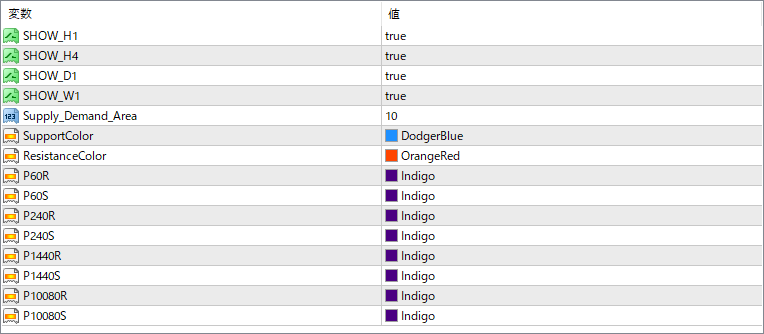
SHOW_H1
Enables or disables the display of support and resistance zones from the H1 timeframe.
SHOW_H4
Enables or disables the display of H4 supply and demand levels.
SHOW_D1
Controls whether D1 timeframe levels are shown on the chart.
SHOW_W1
Displays or hides the support and resistance lines from the W1 timeframe.
Supply_Demand_Area
Defines how many past zones are drawn. A higher value increases the number of visible historical levels.
SupportColor
Sets the color used to draw support zones on the chart.
ResistanceColor
Sets the color used to draw resistance zones on the chart.
P60R / P60S
Defines the color of resistance (R) or support (S) zones from the 60-minute period.
P240R / P240S
Sets the line colors for H4 resistance and support zones respectively.
P1440R / P1440S
Controls the colors for daily timeframe resistance and support zones.
P10080R / P10080S
Sets the line colors for weekly resistance and support zones.