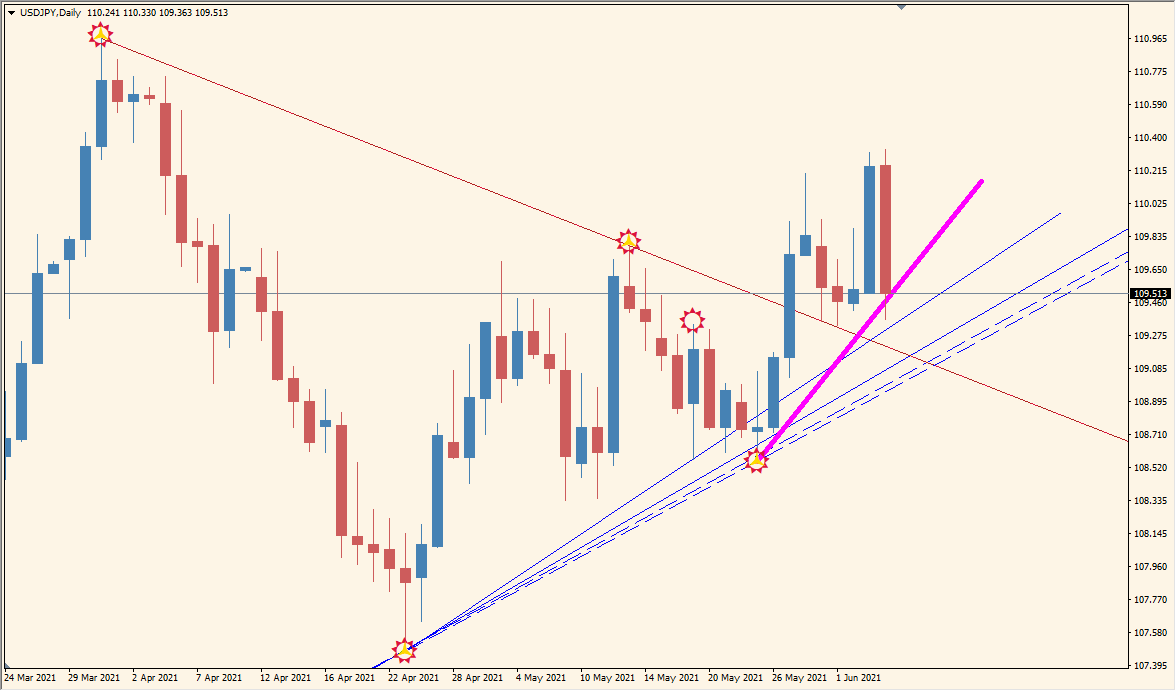
What is Grail Indic Indicator?
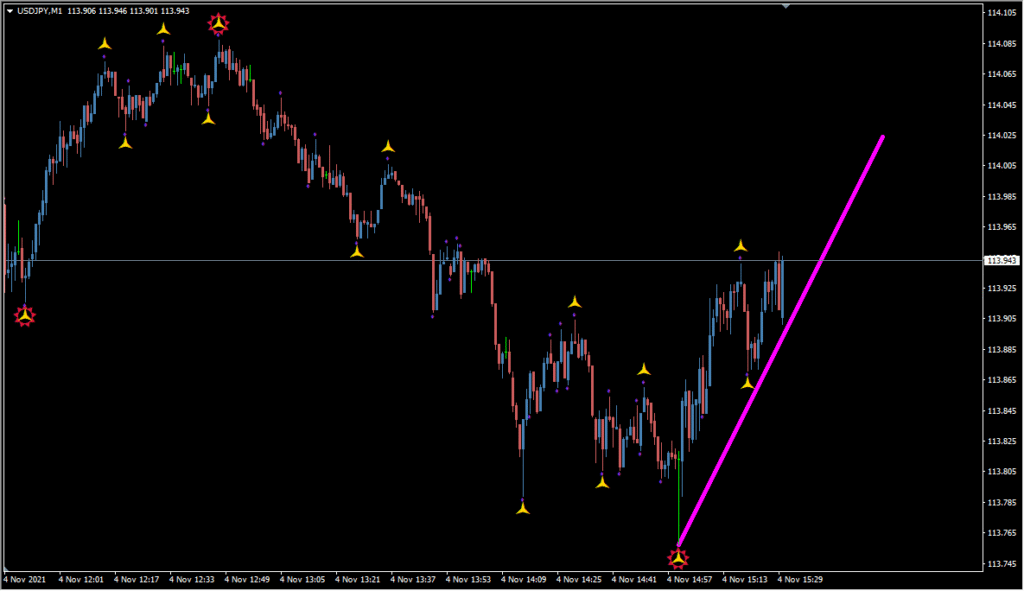
Grail Indic is an MT4 indicator that combines semafor-style pivot markers with high and low trendlines and Fibonacci retracement displays. The chart annotations organize swing structure and make the selected reference areas easier to review.
Settings control pivot sensitivity, line extension, stored pivot counts, colors, widths, and optional text or sound notifications. The annotations describe displayed chart structure rather than a fixed market outcome.
How to Use It in Practice
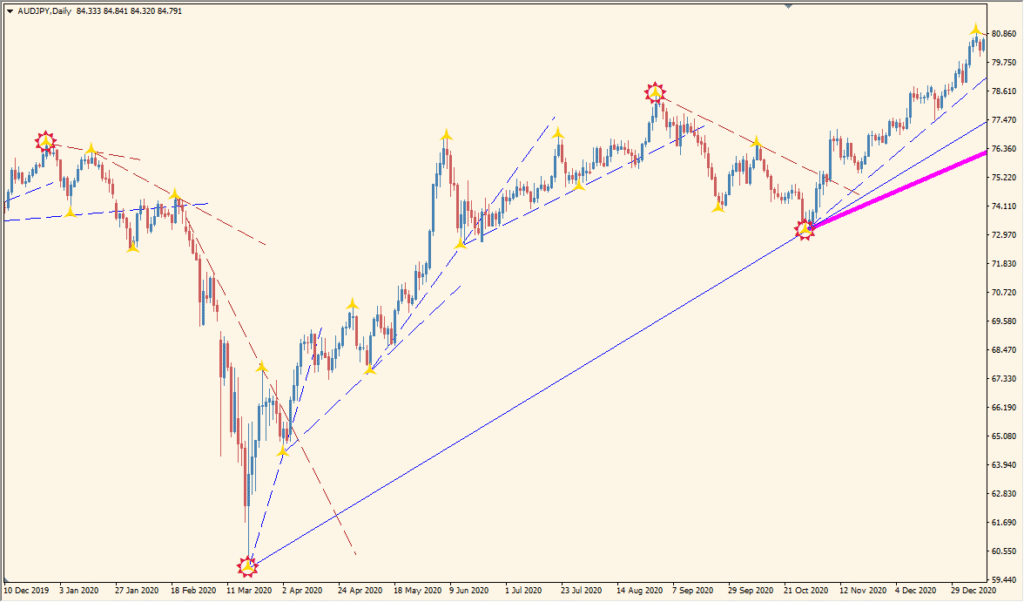
Use the plotted structures as visual references during chart review:
- Add Grail Indic to an MT4 chart and review the high, low, and lowest semafor markers.
- Use the HTL and LTL settings to control high and low trendline display and extension.
- Compare the displayed Fibonacci references with recent swing structure.
- Adjust pivot sensitivity, line colors, widths, and optional alert settings for readability.
Semafor markers, trendlines, and Fibonacci references appear in one chart view, while the existing settings provide control over sensitivity, styling, extension, and notifications.
MT4 Indicator Parameters
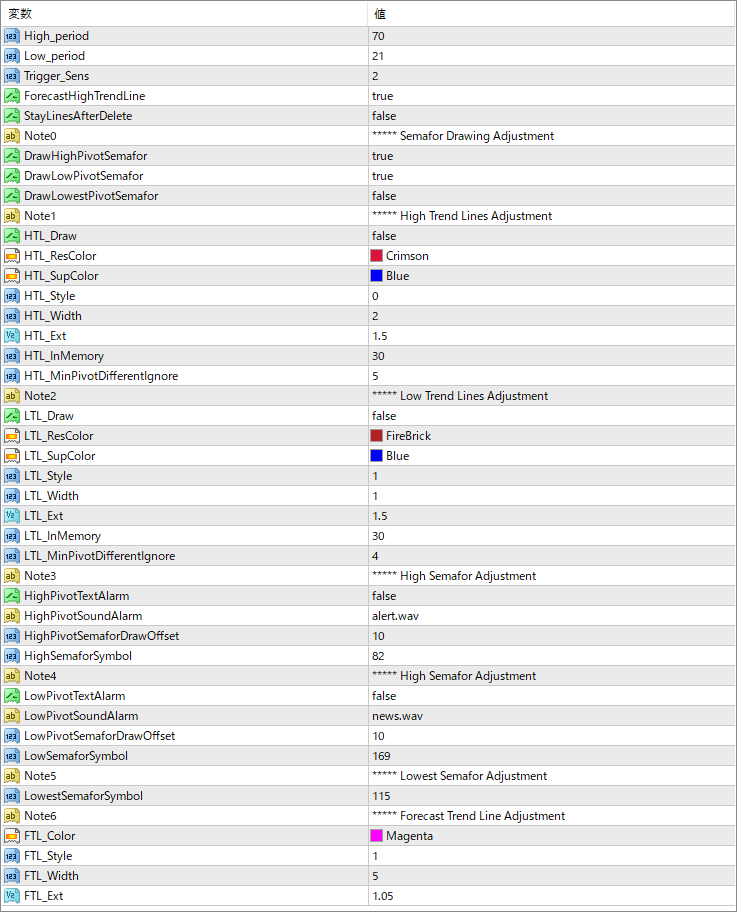
The screenshot above shows the default input parameters in the MT4 settings window.
| Parameter | Description |
|---|---|
| High_period | Sets the sensitivity for detecting major high pivots. |
| Low_period | Sets the sensitivity for detecting major low pivots. |
| Trigger_Sens | Controls how sensitive the trigger is for drawing pivot signals. |
| ForecastHighTrendLine | If true, draws a projected trendline from recent high pivots. |
| StayLinesAfterDelete | If false, removes trendlines when the indicator is removed or refreshed. |
| DrawHighPivotSemafor | If true, displays semafor icons on high pivot points. |
| DrawLowPivotSemafor | If true, displays semafor icons on low pivot points. |
| DrawLowestPivotSemafor | If true, shows the lowest pivot points with a unique symbol. |
| HTL_Draw | If true, enables drawing of high trendlines based on pivots. |
| HTL_ResColor | Sets the color of high resistance trendlines. |
| HTL_SupColor | Sets the color of high trendline supports. |
| HTL_Style | Defines the line style for high trendlines. |
| HTL_Width | Defines the line thickness of high trendlines. |
| HTL_Ext | Specifies how far the trendline is projected into the future. |
| HTL_InMemory | Sets how many pivot points are stored and analyzed. |
| HTL_MinPivotDifferentIgnore | Ignores pivots that are too close in price to previous ones. |
| LTL_Draw | If true, enables drawing of low trendlines. |
| LTL_ResColor | Sets the color of low trendline resistance. |
| LTL_SupColor | Sets the color of low trendline support. |
| LTL_Style | Defines the line style for low trendlines. |
| LTL_Width | Sets the width of low trendlines. |
| LTL_Ext | Sets how far the low trendlines extend forward. |
| LTL_InMemory | Defines how many low pivots are kept for analysis. |
| LTL_MinPivotDifferentIgnore | Filters out nearby pivots that may not be structurally significant. |
| HighPivotTextAlarm | Enables or disables textual alert when high pivots appear. |
| HighPivotSoundAlarm | Specifies the sound file to play on high pivot signal. |
| HighPivotSemaforDrawOffset | Vertical offset for semafor symbols on high pivots. |
| HighSemaforSymbol | Symbol code used to mark high semafor pivot points. |
| LowPivotTextAlarm | Enables or disables text alert for low pivots. |


