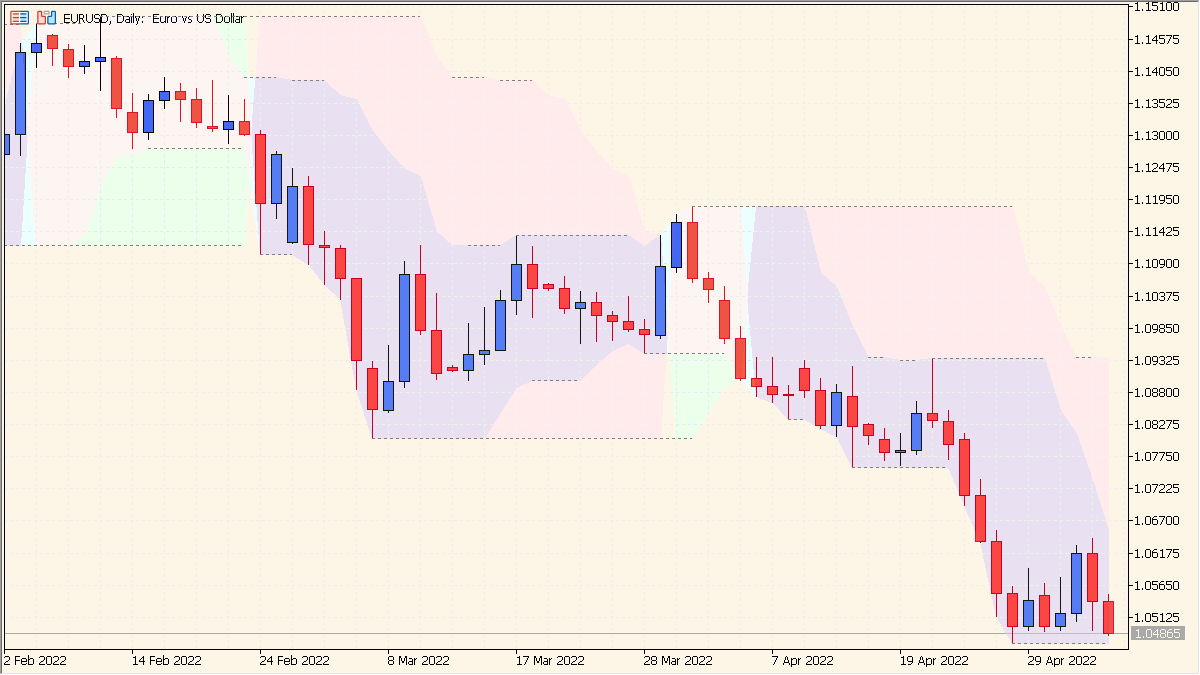
What is Highest High – Lowest Low SR Indicator?
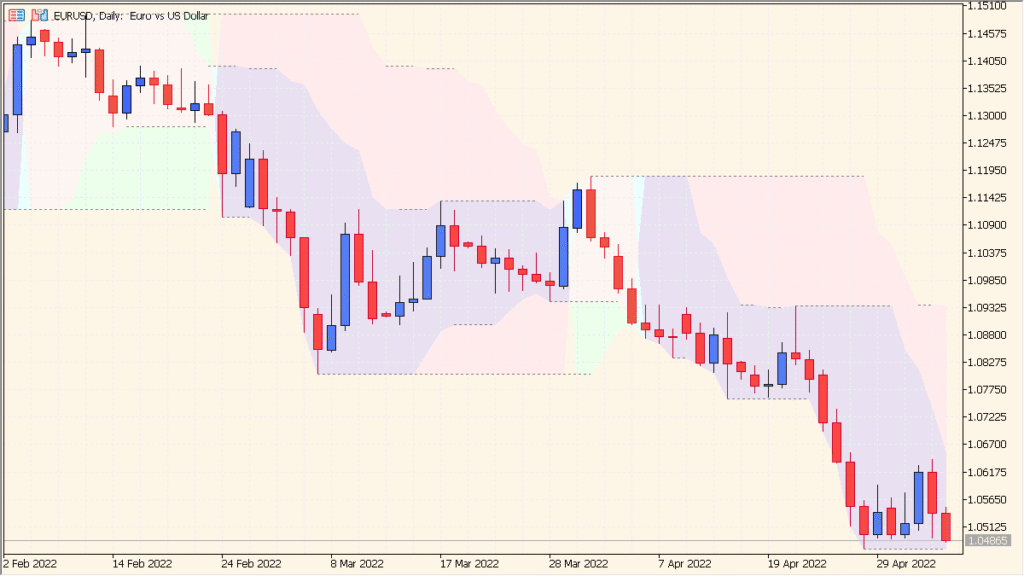
Highest High Lowest Low SR displays two high-low bands calculated from separate periods. Their overlap is shown in purple, while the default source display uses 8 and 21 periods.
The two band-period settings are the available controls; changing them alters the high-low ranges that are drawn on the chart.
How to Use It in Practice
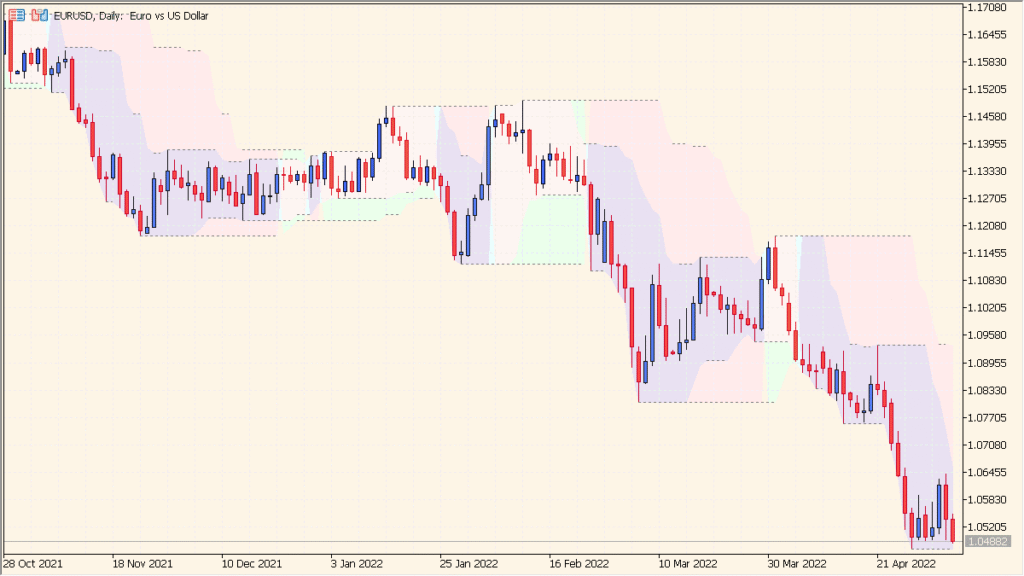
Two high-low bands are drawn from separate lookback periods. Their overlap is colored purple; the default pair is 8 and 21 periods, and the overlap can also appear while price continues strongly in one direction.
- Locate the two bands first, then identify the purple area where their ranges overlap.
- Change the two band-period settings to lengthen or shorten the high-low ranges; longer settings may be more useful than the default 8 and 21.
- Compare an overlap with the surrounding candles and the broader chart state, because overlap alone is also visible during a strong continuing move.
Recent high-low structure is marked automatically, two lookback layers support comparison, and display options manage chart density.
MT5 Indicator Parameters
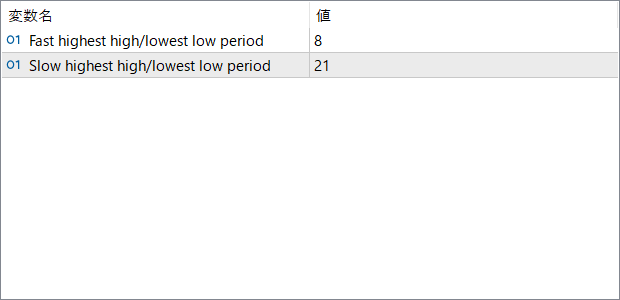
The screenshot above shows the default input parameters in the MT5 settings window.
| Parameter | Description |
|---|---|
| Fast highest high/lowest low period | Defines the number of bars used to calculate the fast dynamic zone. Shorter periods respond quickly to recent price action and highlight short-term support and resistance. |
| Slow highest high/lowest low period | Defines the number of bars used for the slow dynamic zone. Longer periods smooth out noise and display more stable, higher timeframe support and resistance areas. |


