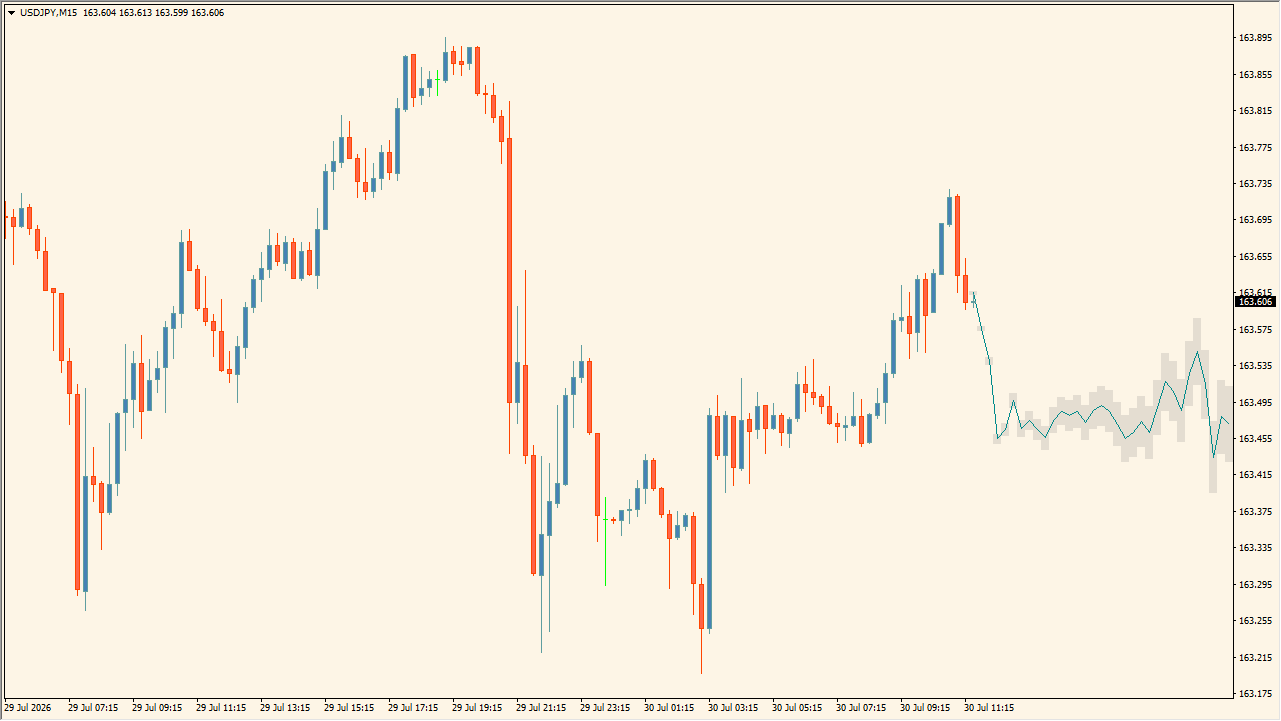
What is Historical Price Projection?
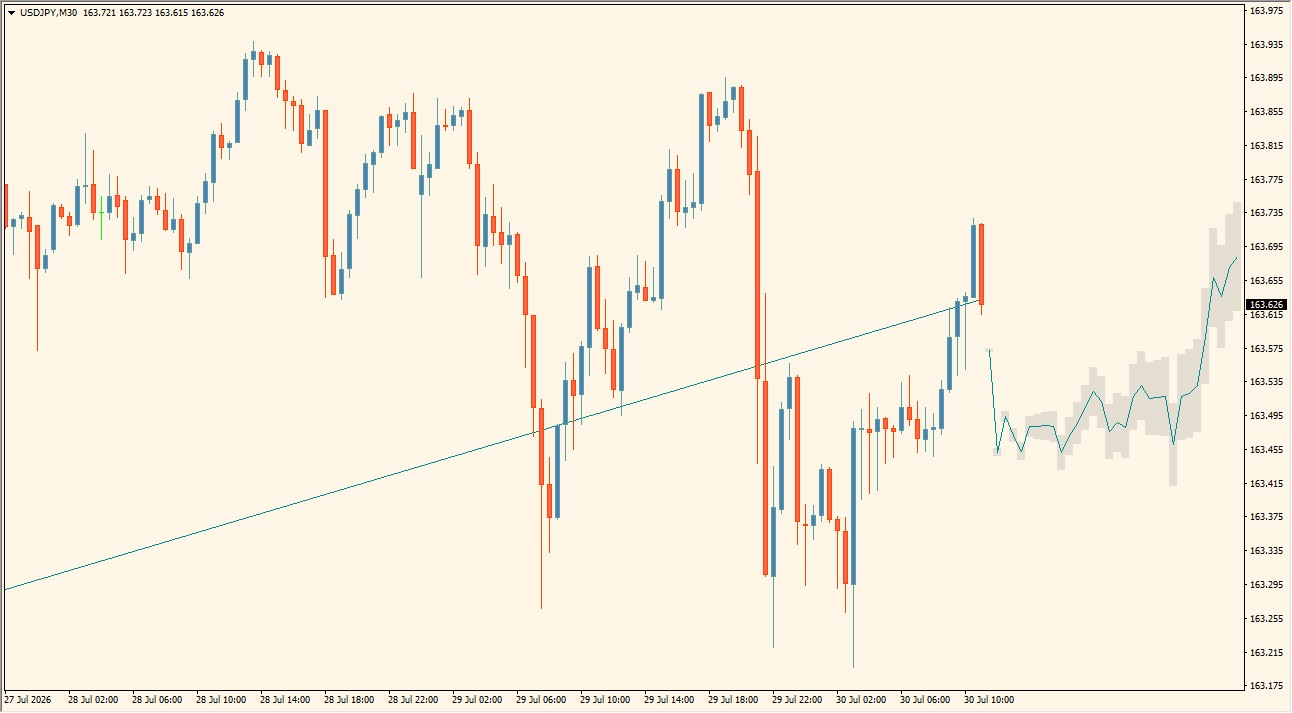
Historical Price Projection is an MT4 indicator that compares the current price sequence with historical price movement and extends a teal projected path into the chart's right-hand side, surrounded by a gray area.
A vertical execution-window line marks where the comparison begins, keeping the projected path intended as a visual comparison with the candles that subsequently form, rather than as a fixed forecast, alongside the current chart view.
How to use Historical Price Projection
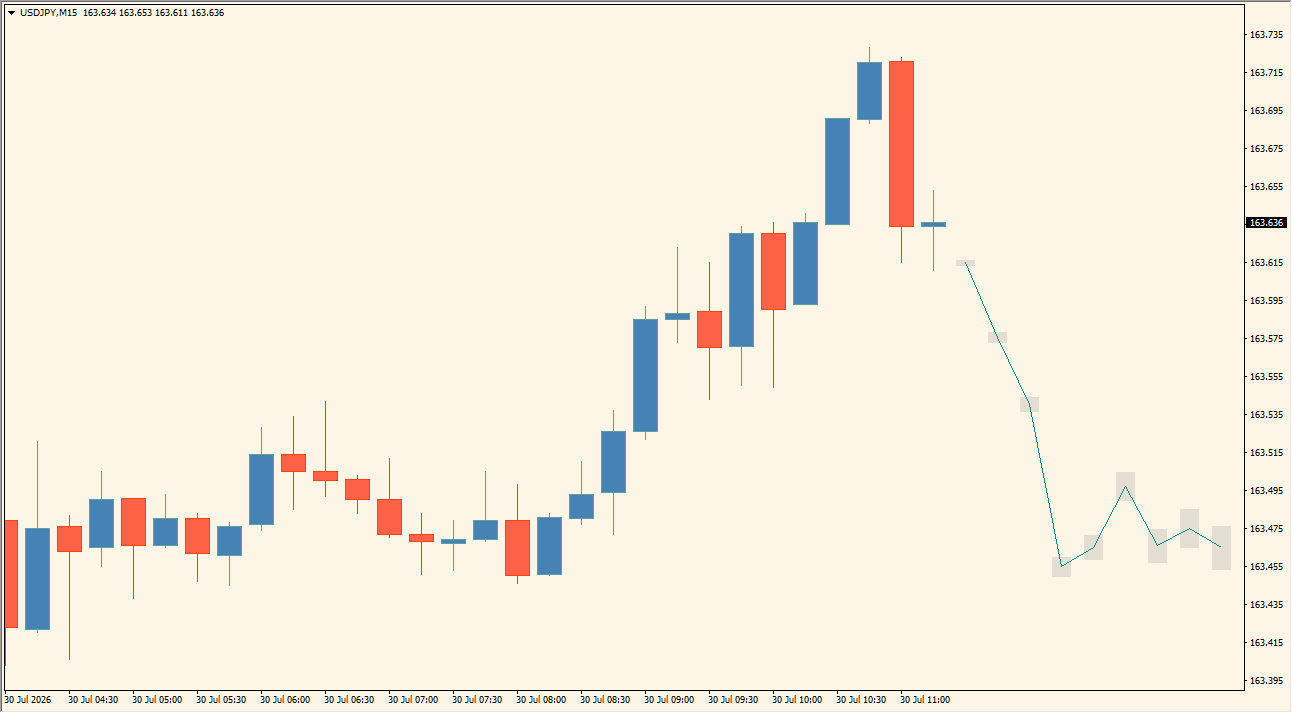
Read the projection together with the candles that form after the marked starting point:
Where it helps
The vertical execution-window line marks the starting point for the displayed comparison, the projected line and its surrounding area have independent display settings, and Max Bars to Use controls how much chart history is considered.
MT4 Indicator Parameters
The table below lists the available MT4 indicator parameters. You can customize these options in the MetaTrader Inputs dialog to match your trading preferences.
| Parameter | Description |
|---|---|
| Data Gathering | Data-gathering settings section. |
| Max Bars to Use | Sets the maximum number of historical bars considered. Default: 500. |
| Data transformation | Data-transformation settings section. |
| Growth Factor | Controls the projection growth transformation. Default: 0. |
| Area Width | Sets the width of the surrounding projection area. Default: 5. |
| Style | Display-style settings section. |
| Projection Line Width | Sets the projected line width. Default: 1. |
| Bullish | Sets the bullish-side display color. Default: 0,139,139. |
| Bearish | Sets the bearish-side display color. Default: Crimson. |
| Execution Window Line | Shows or hides the vertical execution-window line. Default: true. |
| Show Area | Shows or hides the surrounding area. Default: true. |
| Area | Sets the surrounding-area color. Default: Gray. |
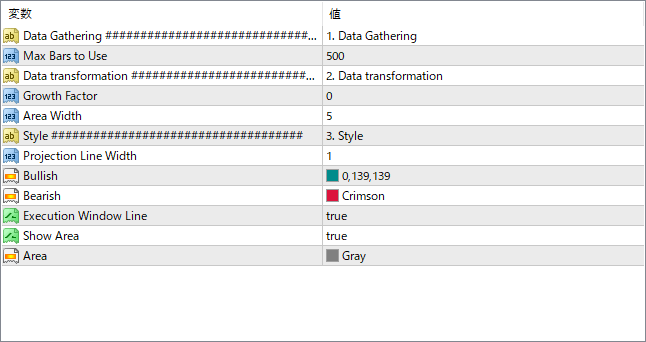
The screenshot above shows the default input parameters in the MT4 settings window.
How to Install .ex4 Indicator in MetaTrader 4
- Download the ZIP file and extract it.
- In MT4, select File → Open Data Folder.
- Open MQL4 → Indicators and copy the EX4 or MQ4 file into it.
- If the package includes library files, copy them to MQL4 → Libraries. Copy TPL files to the top-level templates folder.
- Restart MT4, find the indicator in the Navigator, and drag it onto a chart.
Test the tool on a demo account first. File contents and required folders can vary between packages.


