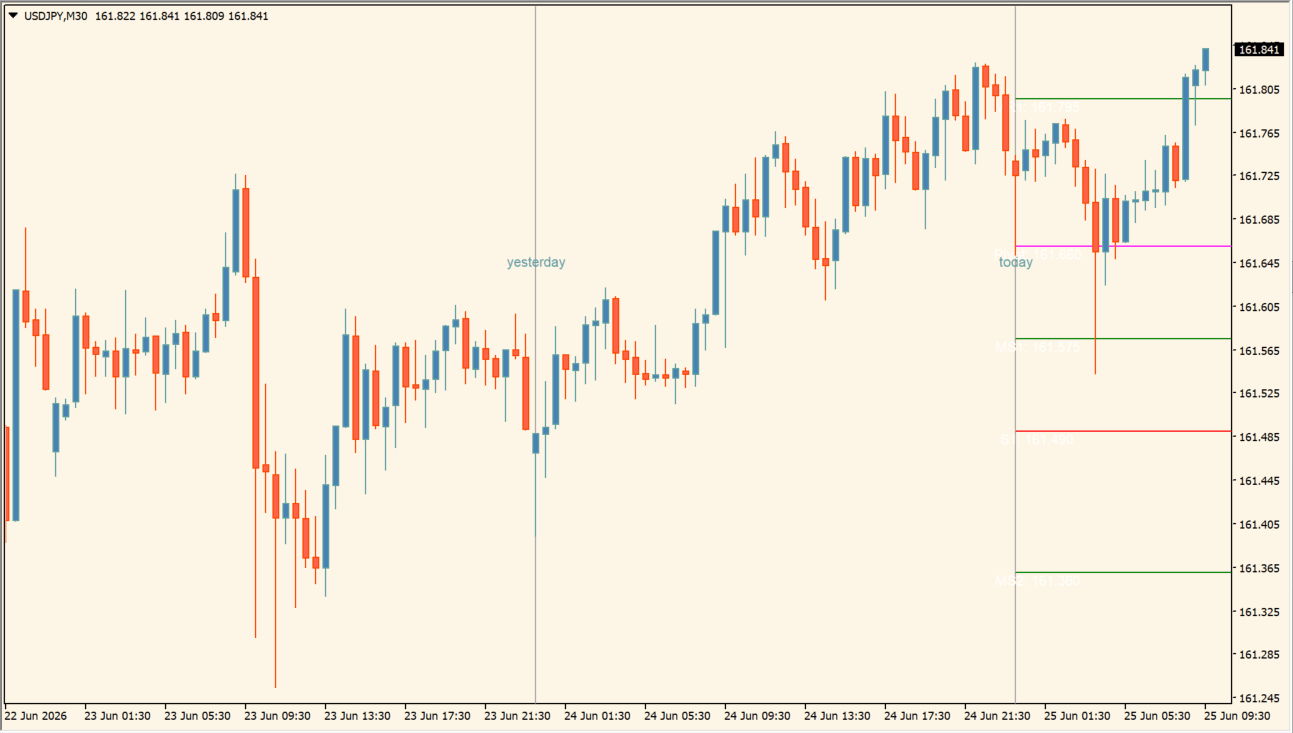
What is ICT GMT Pivots?
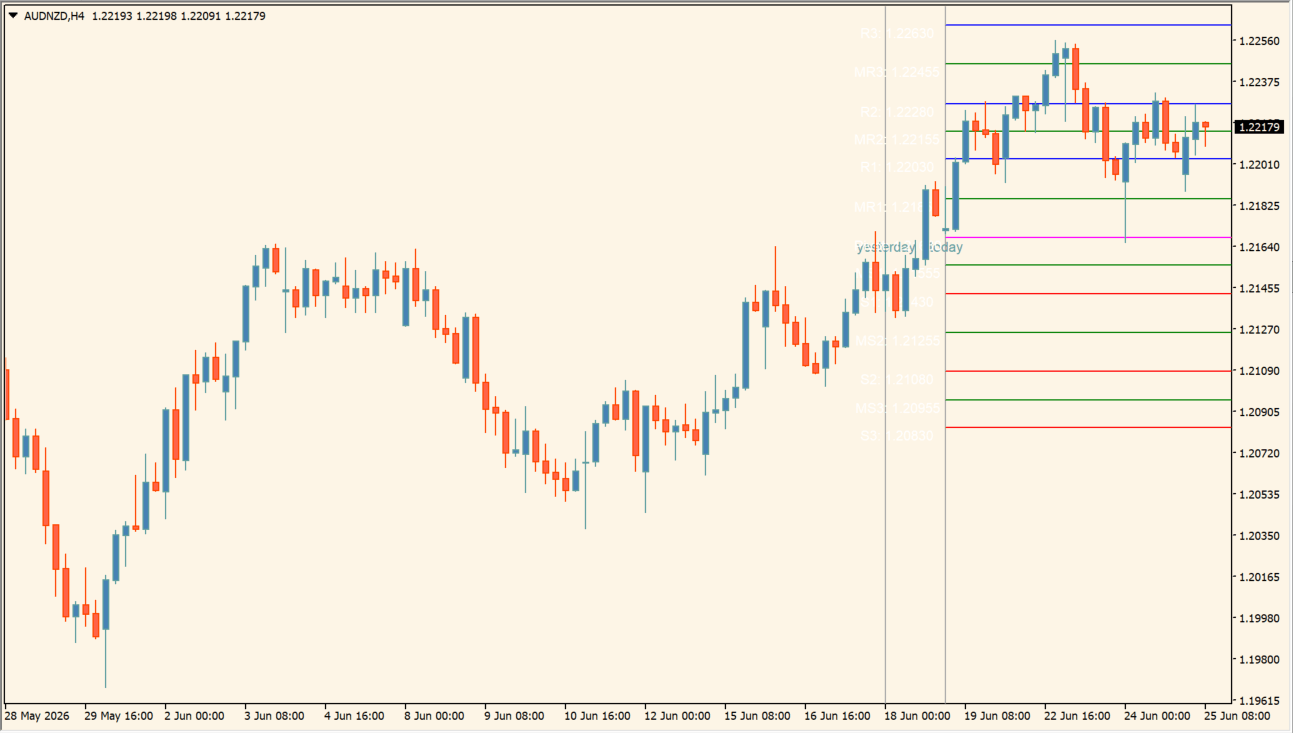
ICT GMT Pivots plots pivot-style horizontal lines on the MT4 chart. The display can include pivots, mid-pivots, support lines, Fibonacci lines, and Camarilla lines, and each level can show its price beside it.
The indicator prints no trade arrows. LocalTimeZone sets the local-side time and DestTimeZone adjusts the time zone used as the display reference, so the same levels can be viewed against a chosen clock.
How to use ICT GMT Pivots
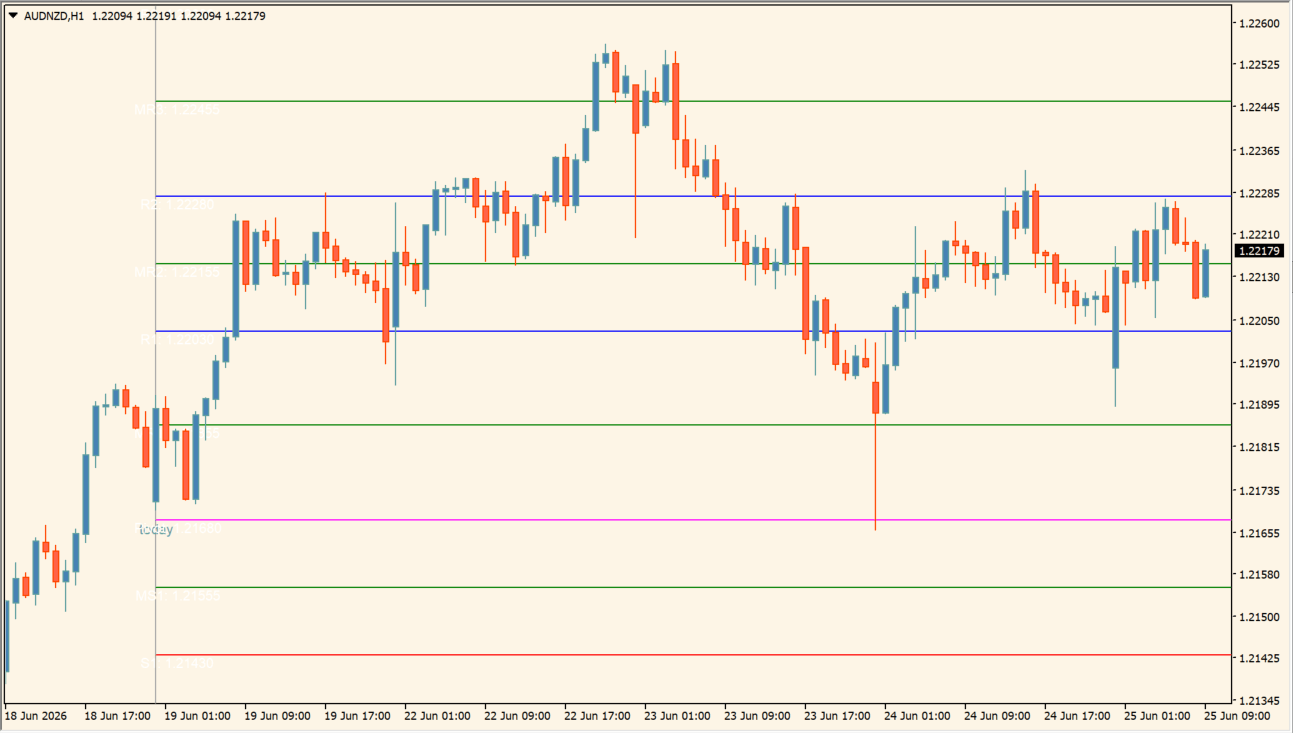
Watch whether price turns at a line or clears it and moves on to the next one. Note which lines sit above and below the current price.
- Watch whether price turns at a line or clears it and moves on to the next one.
- During an advance, note which pivots and mid-pivots sit below the current price.
- When price approaches a line above, note whether the candles stall there or pass through it.
- In a strong trend, price often runs straight through a level rather than reacting to it.
- Turn ShowPivots, ShowMidPivots, ShowFibos, and ShowCamarilla on or off to keep only the lines you want, and use ShowLevelPrices with the line-style Inputs to keep labels readable.
Where it helps
Pivots, mid-pivots, Fibonacci lines, and Camarilla lines can each be turned on without drawing them by hand, turning individual groups off leaves only the references you want, and prices printed beside the lines keep each level readable.
MT4 Indicator Parameters
The table below lists the available MT4 indicator parameters. You can customize these options in the MetaTrader Inputs dialog to match your trading preferences.
| Parameter | Description |
|---|---|
| Local Time Zone | Sets the local-side time setting. Default: 0. |
| Destination Time Zone | Adjusts the time zone used as the display reference. Default: 0. |
| Line Style | Sets the MT4 line-style code. Default: 2. |
| Line Thickness | Sets the line width. Default: 1. |
| Show Chart Comment | Shows or hides indicator comments. Default: false. |
| Show High/Low/Open | Turns the high, low, and open display on or off. Default: false. |
| Show Sweet Spots | Shows or hides supplementary sweet-spot levels. Default: false. |
| Show Pivots | Shows the main pivot, support, and resistance levels. Default: true. |
| Show Mid-Pivots | Shows the intermediate pivot levels. Default: true. |
| Show Fibonacci Pivots | Shows Fibonacci-derived pivot levels. Default: false. |
| Show Camarilla Pivots | Shows Camarilla levels. Default: false. |
| Show Level Prices | Prints the calculated price beside each level. Default: true. |
| Label Bar Offset | Sets the horizontal bar offset used for level labels. Default: 10. |
| Debug Logging | Enables diagnostic logging when required. Default: false. |
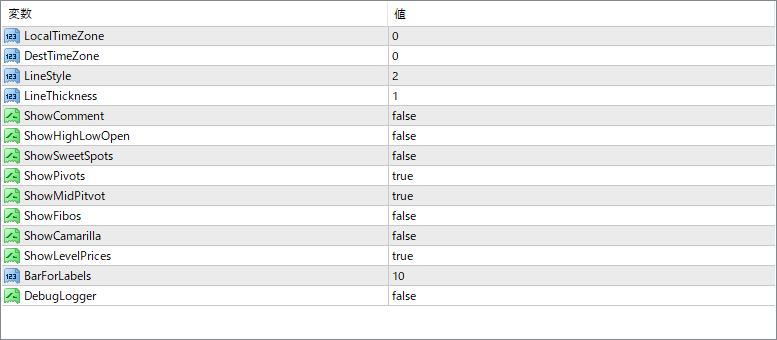
The screenshot above shows the default input parameters in the MT4 settings window.
How to Install .ex4 Indicator in MetaTrader 4
- Download the ZIP file and extract it.
- In MT4, select File → Open Data Folder.
- Open MQL4 → Indicators and copy the EX4 or MQ4 file into it.
- If the package includes library files, copy them to MQL4 → Libraries. Copy TPL files to the top-level templates folder.
- Restart MT4, find the indicator in the Navigator, and drag it onto a chart.
Test the tool on a demo account first. File contents and required folders can vary between packages.


