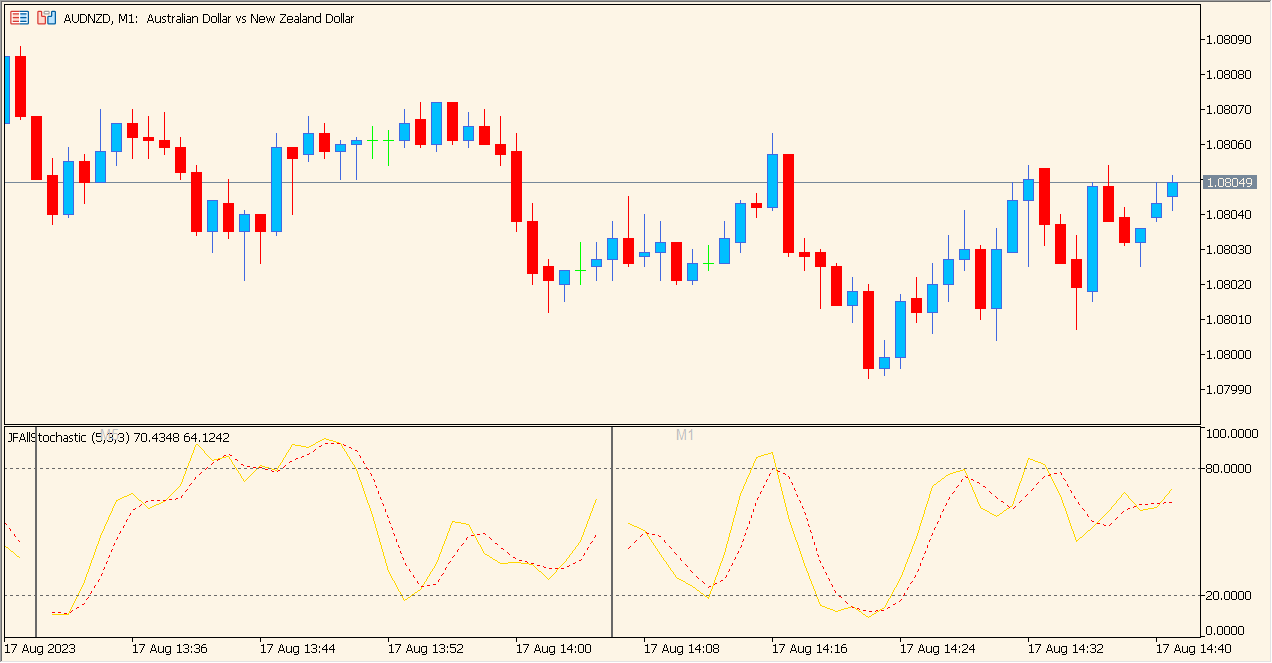
What is JFAllStochastic Indicator?
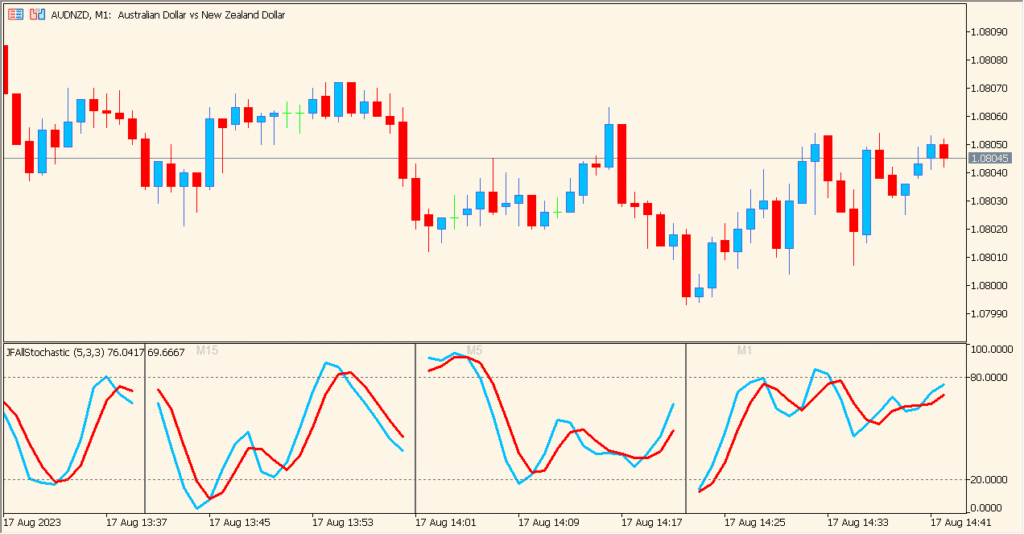
JFAllStochastic is an MT5 panel that displays Stochastic Oscillator readings from selected timeframes in a stacked view. The K period, D period, slowing, moving-average method, and price field determine the oscillator calculations shown in each row.
Timeframe separators, colors, and horizontal placement make the panel easier to read while comparing the same oscillator across chart horizons. The readings are visual references and do not by themselves prescribe a market action.
How to Use It in Practice
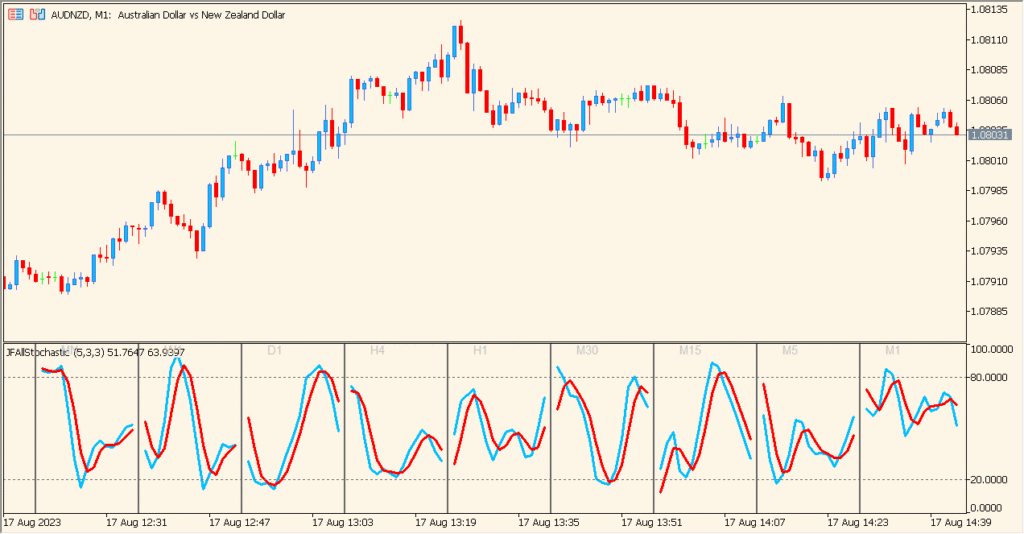
Read the stacked Stochastic sections as repeating blocks of candles: barsPerTimeFrame determines the width of each block, allowing the selected timeframe rows to be compared without changing charts.
- Compare the Stochastic shape in each displayed row with the candles covered by the same separator block.
- Set Kperiod, Dperiod, Slowing, MAMethod, and PriceField before comparing rows.
- Choose the desired timeframe rows from the periodicity-bar options.
- Change barsPerTimeFrame to alter the number of candles shown in each section, then use shiftRight and currentFirst to arrange the panel.
- Use separator and text colors to keep timeframe boundaries readable while comparing the panel with price history.
Several timeframe readings share one panel, separators keep each row organized, and configurable oscillator and layout settings support structured comparison.
MT5 Indicator Parameters
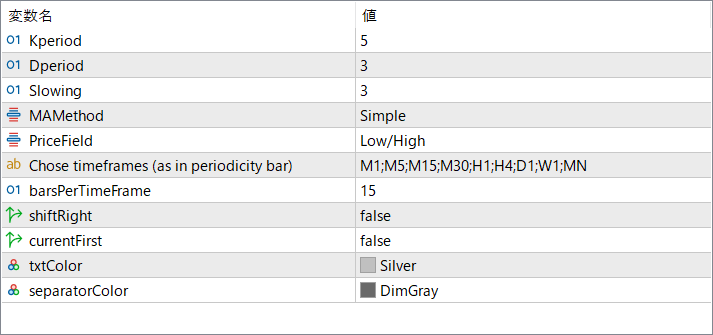
The screenshot above shows the default input parameters in the MT5 settings window.
| Parameter | Description |
|---|---|
| Kperiod | Sets the lookback period for the Stochastic’s %K calculation. A larger value smooths the oscillator and reduces noise. |
| Dperiod | Defines the smoothing period for the %D line. This controls how responsive or slow the signal line becomes. |
| Slowing | Adds additional smoothing to the %K calculation, reducing fast fluctuations. |
| MAMethod | Selects the moving average method used in the smoothing process (such as Simple or other MA types). |
| PriceField | Chooses which price set is used in the Stochastic formula (e.g., Low/High or Close/Close). |
| Chose timeframes (as in periodicity bar) | Lists the timeframes displayed in the panel. Each one generates its own Stochastic plot. |
| barsPerTimeFrame | Controls how many bars are shown horizontally for each timeframe section. |
| shiftRight | Moves the entire panel to the right side of the chart when enabled, leaving spacing on the left. |
| currentFirst | Displays the current timeframe at the top of the panel when set to true. If false, the order follows the list sequence. |
| txtColor | Sets the color of the labels shown inside each timeframe panel. |
| separatorColor | Defines the color of the horizontal separators between each timeframe section. |


