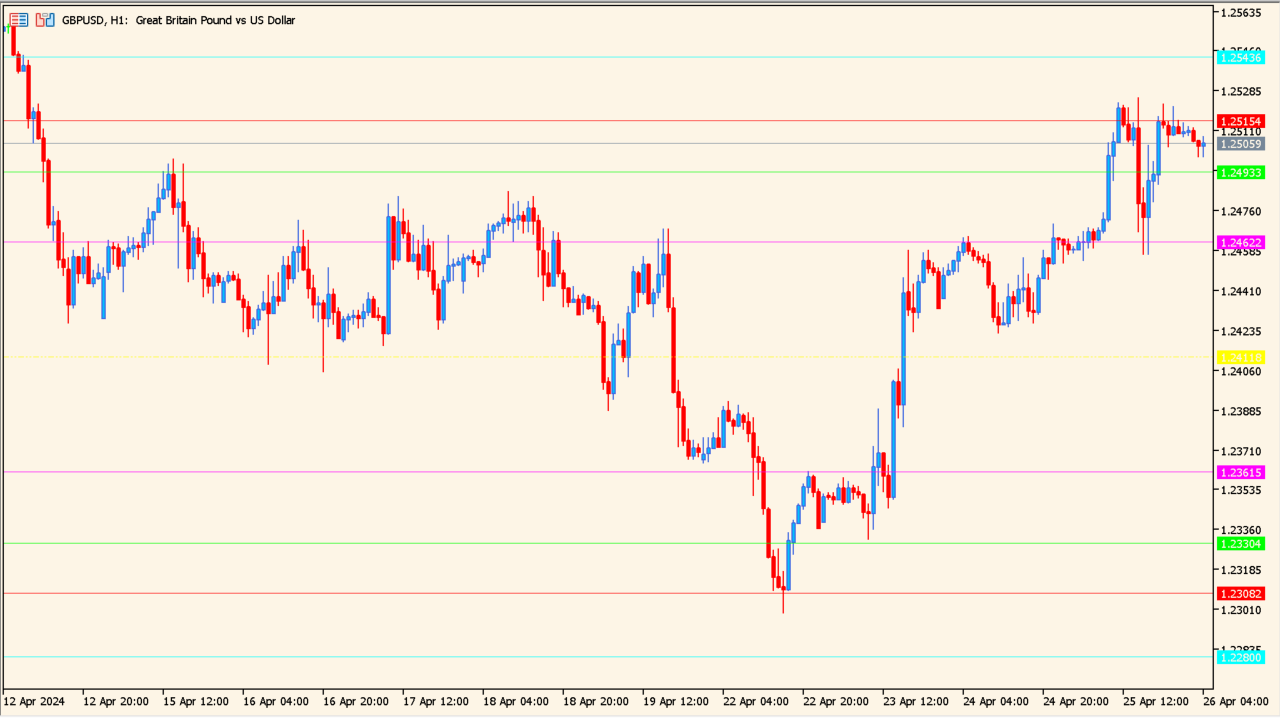
What is JFPivot Indicator?
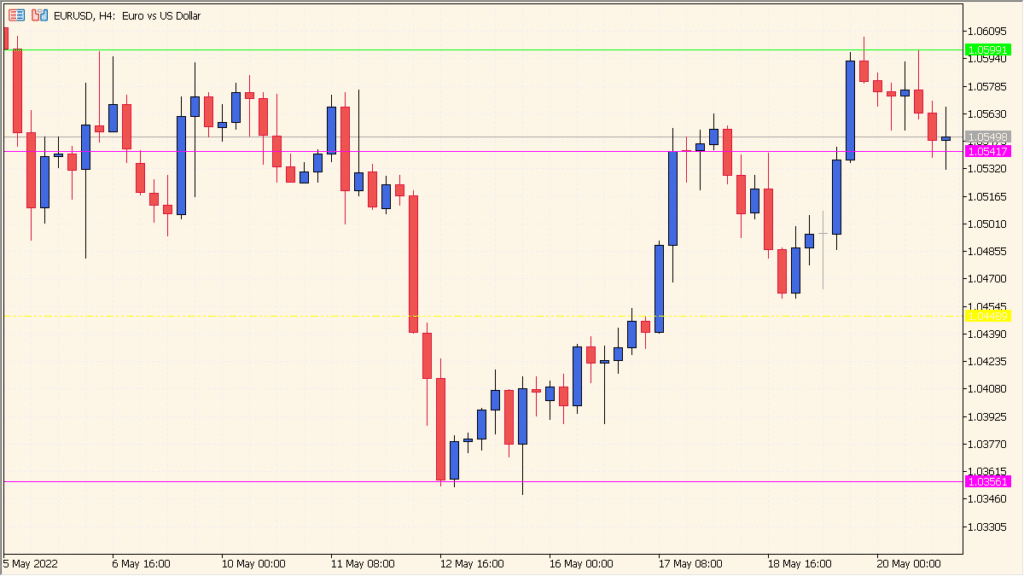
JFPivot is an MT5 indicator that displays a central pivot with support and resistance reference lines calculated from higher-timeframe data. Standard or Fibonacci-style methods, timezone options, colors, and labels control the chart layout.
The levels organize daily chart context and make higher-timeframe references easy to compare with current price. They are plotted levels for chart review, not fixed destinations.
How to Use It in Practice
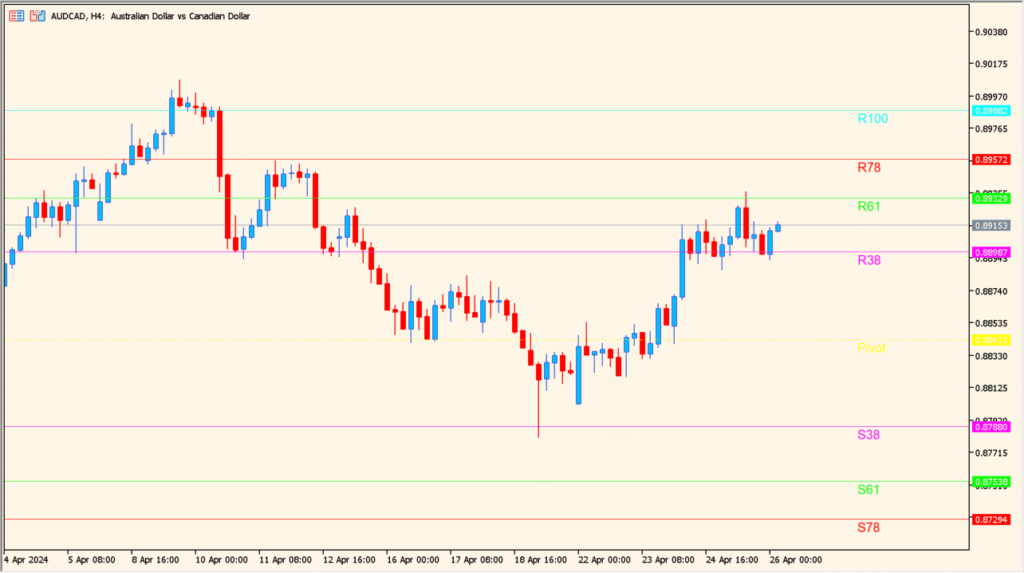
Read the central pivot and its surrounding lines as a grid calculated from the preceding higher-timeframe high and low; Fibonacci-ratio spacing and labels are also displayed where that method is selected.
- Review the central pivot first, then compare the adjacent support and resistance references as one level set.
- Use the Fibonacci-style method when the ratio-labelled lines are the grid you want to inspect.
- Set Timeframe Of Pivot and Time Zone Of Date to align the higher-timeframe calculation with the chart context.
- Compare daily, weekly, or monthly grids separately rather than assuming that levels from different periods mean the same thing.
Daily pivot references are organized automatically, calculation methods can be compared, and labels keep the level grid readable.
MT5 Indicator Parameters
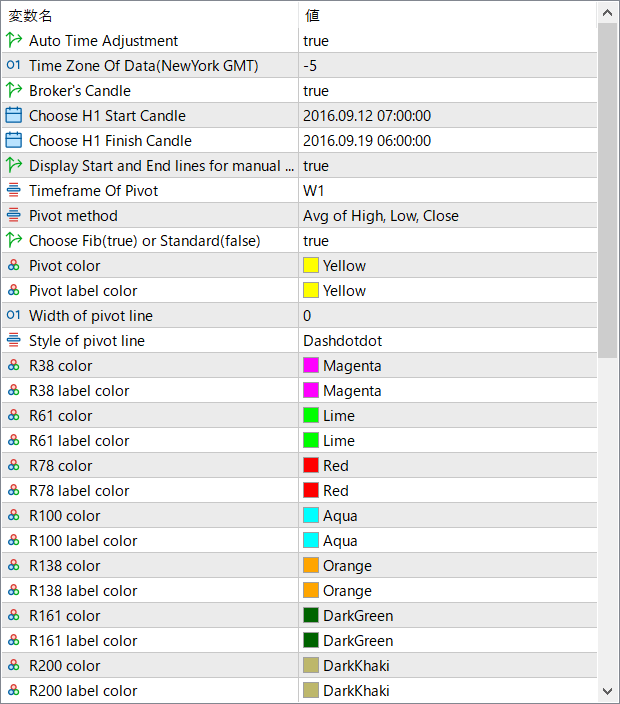
The screenshot above shows the default input parameters in the MT5 settings window.
| Parameter | Description |
|---|---|
| Auto Time Adjustment | Automatically aligns pivot calculations with the correct trading session based on time zone settings. |
| Time Zone Of Data (NewYork GMT) | Defines the reference time zone used for pivot calculations, typically aligned with the New York trading session. |
| Broker’s Candle | Uses the broker’s candle structure when calculating pivot levels. |
| Choose H1 Start Candle | Specifies the starting candle used for manual pivot range calculations. |
| Choose H1 Finish Candle | Defines the ending candle for manual pivot range calculations. |
| Display Start and End lines for manual | Shows visual guide lines on the chart when manual pivot ranges are used. |
| Timeframe Of Pivot | Selects the timeframe from which pivot levels are calculated, such as daily or weekly. |
| Pivot method | Chooses how the pivot point is calculated, such as using the average of high, low, and close. |
| Choose Fib (true) or Standard (false) | Switches between Fibonacci-based pivot levels and standard pivot calculations. |
| Pivot color | Sets the line color of the main pivot level. |
| Pivot label color | Controls the color of the pivot level label text. |
| Width of pivot line | Adjusts the thickness of the pivot line. |
| Style of pivot line | Defines the visual style of the pivot line, such as solid or dashed. |
| R38 / R61 / R78 / R100 / R138 / R161 / R200 color | Sets the line colors for each resistance level. |
| S38 / S61 / S78 / S100 color | Sets the line colors for each support level. |


