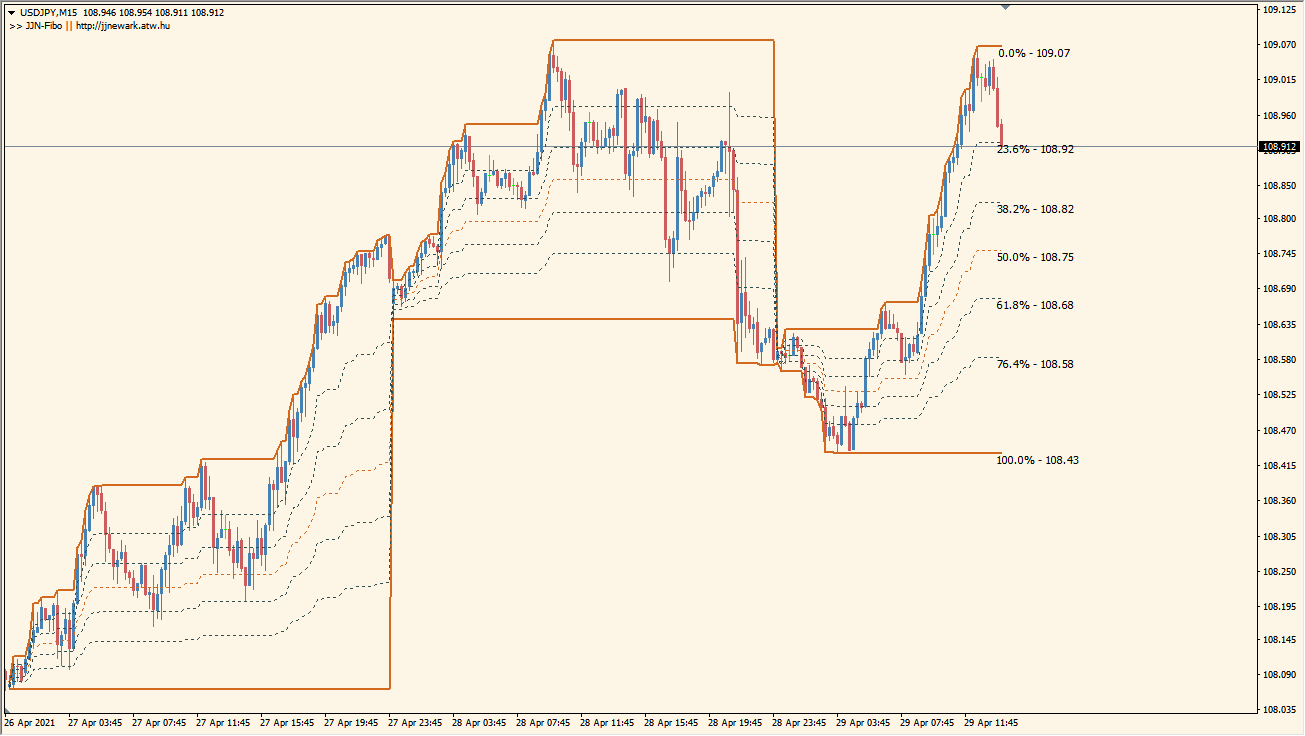
What is JJN-Fibo Indicator?
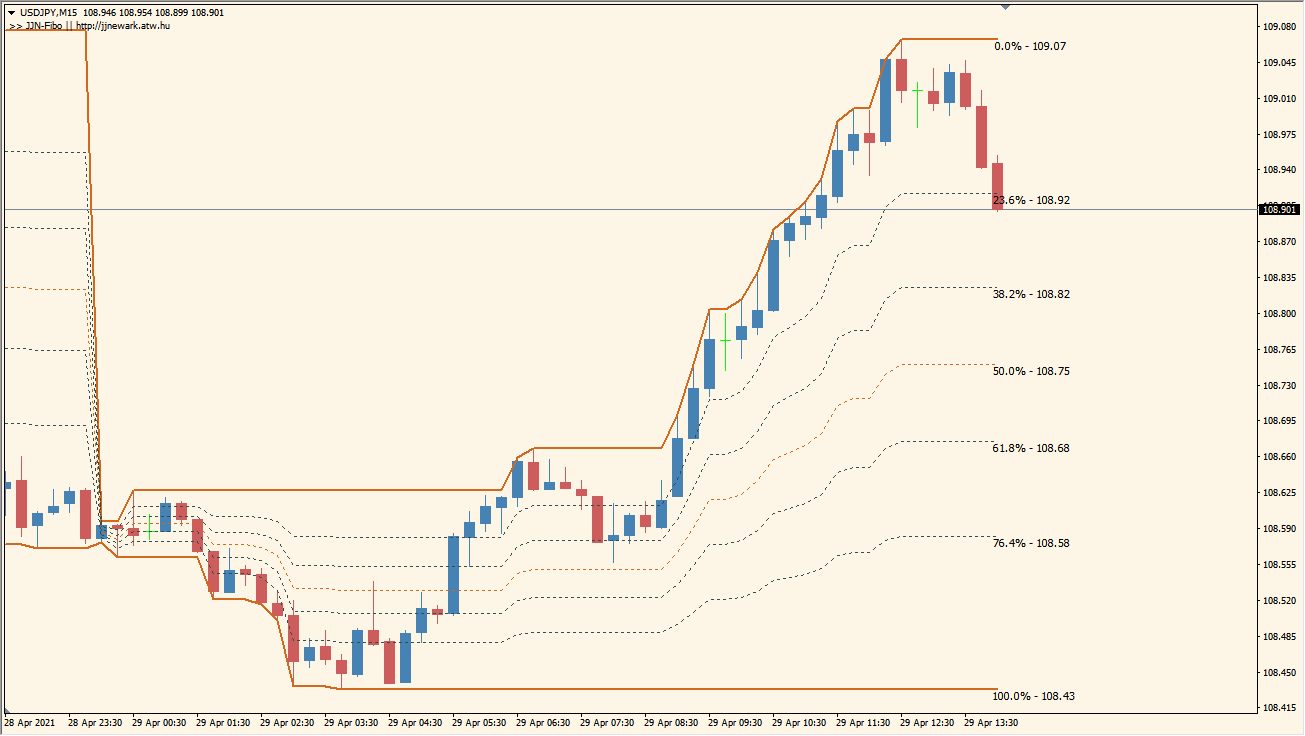
JJN-Fibo redraws Fibonacci levels from each day’s current high and low. When either daily extreme changes, the plotted level set is recalculated from that updated range.
ProcessedUnits controls how many days of these daily Fibonacci drawings remain visible. The display describes the developing daily high-low range rather than a fixed projection.
How to Use It in Practice
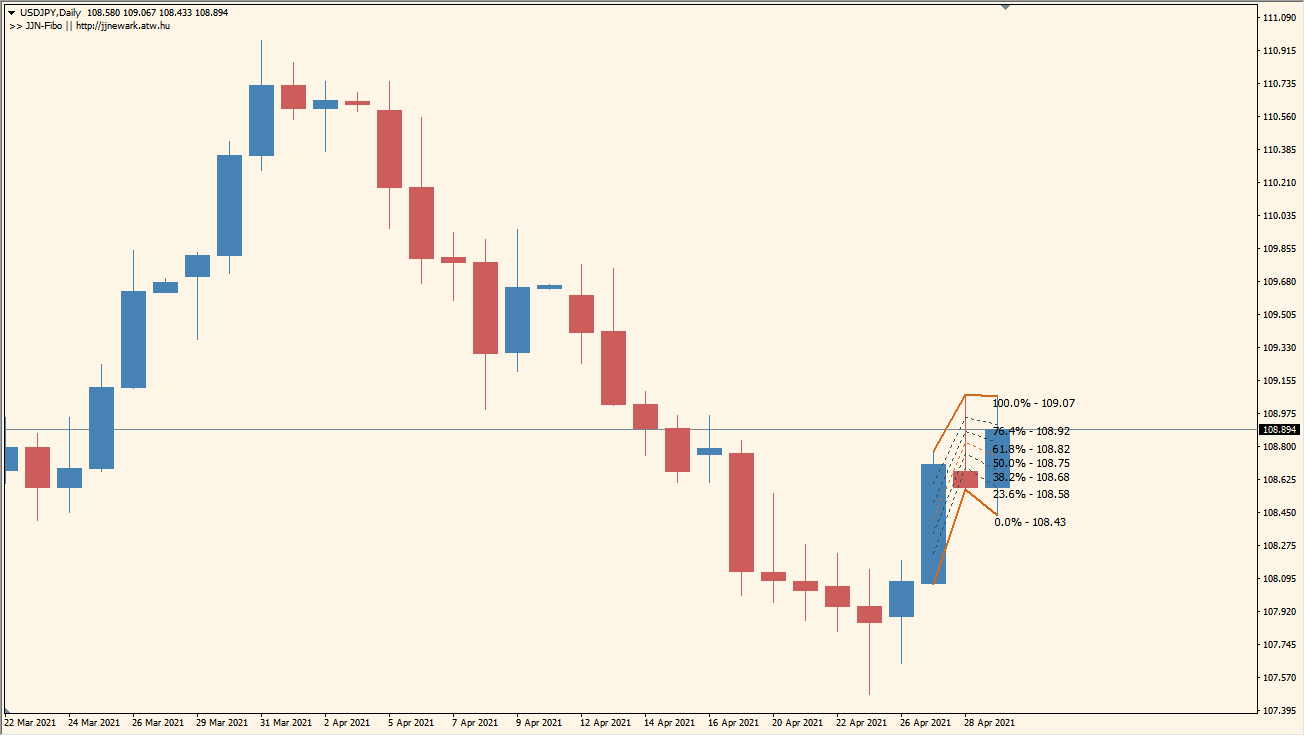
JJN-Fibo draws Fibonacci levels between the current day’s high and low, then redraws them whenever either daily extreme is updated.
- Read the level set as the current daily high-low range and note its redraw when the day makes a new high or low.
- Set ProcessedUnits to retain the desired number of prior daily drawings; the default is one day.
- On a daily chart the one-day construction can look compressed, so check the same display on an intraday chart when reviewing the daily range.
Higher-timeframe retracement levels remain visible on the current chart, the source timeframe and historical scope are configurable, and label color and precision support a clearer display.
MT4 Indicator Parameters
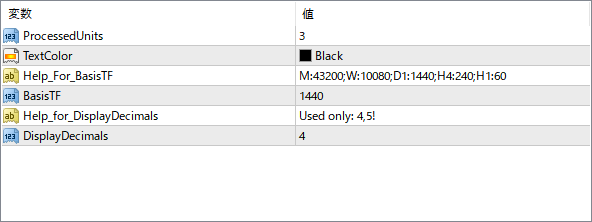
The screenshot above shows the default input parameters in the MT4 settings window.
| Parameter | Description |
|---|---|
| ProcessedUnits | Specifies how many historical swing points the indicator should process when calculating Fibonacci levels. |
| TextColor | Sets the color of the Fibonacci level labels displayed on the chart. |
| Help_For_BasisTF | A reference note showing how to configure the timeframe format. It includes example codes like M:43200 for monthly or D1:1440 for daily. |
| BasisTF | Defines the base timeframe (in minutes) from which the Fibonacci retracement is drawn. For example, 1440 means Daily timeframe. |
| Help_for_DisplayDecimals | Provides guidance for decimal precision. Used only in version 4.5 of the platform. |
| DisplayDecimals | Sets the number of decimal places shown on the Fibonacci price labels. |


