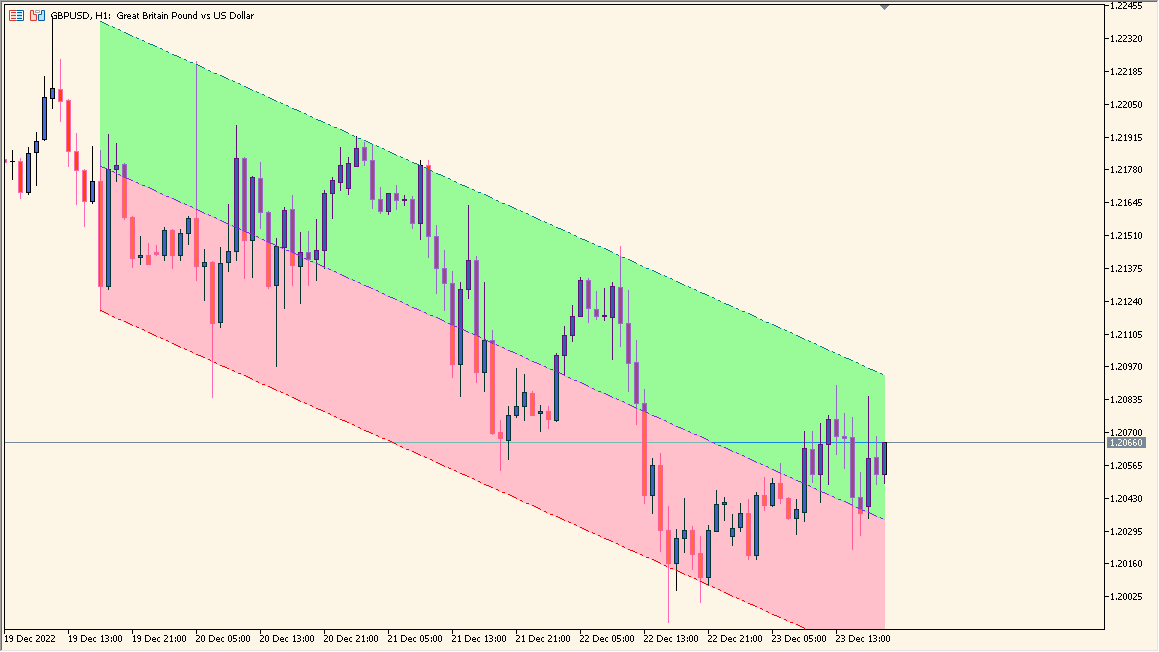
What is Linear Regression Channel Cloud Indicator?
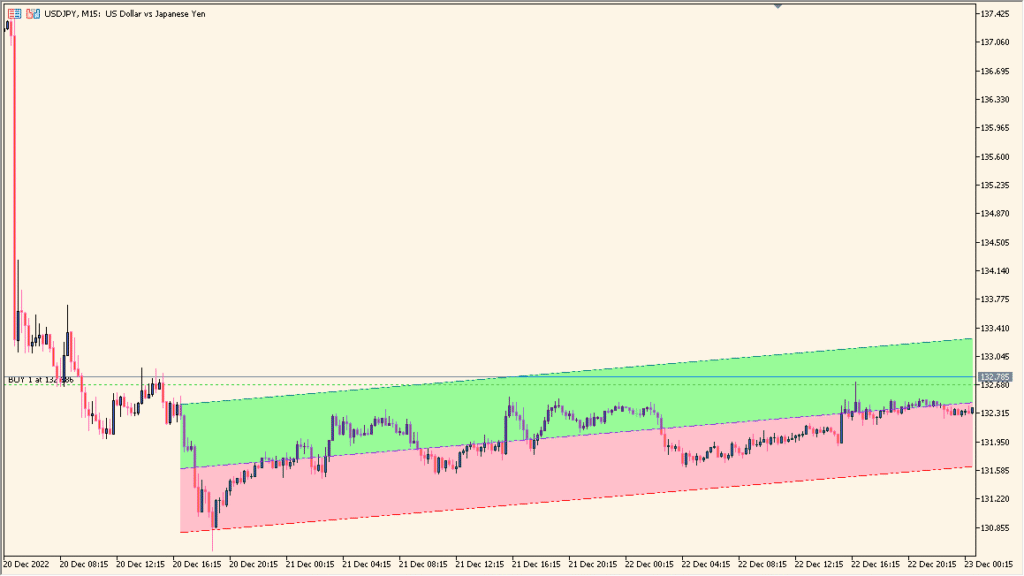
Linear Regression Channel Cloud is an MT5 chart indicator that draws a regression line with upper and lower deviation bands and a shaded cloud between them. Period, deviation, source, colors, and style settings control the display.
The cloud makes the current regression range and slope easier to compare with price behavior. Its boundaries are visual references and do not define a fixed reaction or future path.
How to Use It in Practice
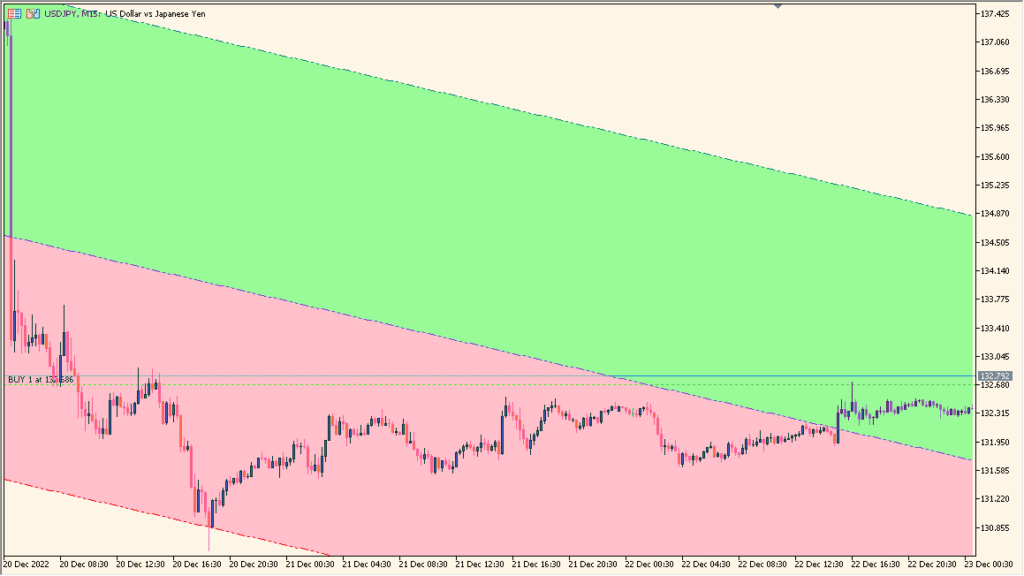
Read the center regression line, upper and lower channel lines, and the cloud as one drawing over the selected historical sample:
- Compare the channel slope and width with the high-low range that the selected period contains.
- Use the lower Input group to change the regression lookback; keeping it roughly between 100 and 300 avoids folding too much old price into the drawing.
- Recheck the latest section as new highs or lows appear, because the channel lines can be redrawn.
The regression path and deviation range are visible together, while a shaded cloud makes the chart area easier to scan.
MT5 Indicator Parameters
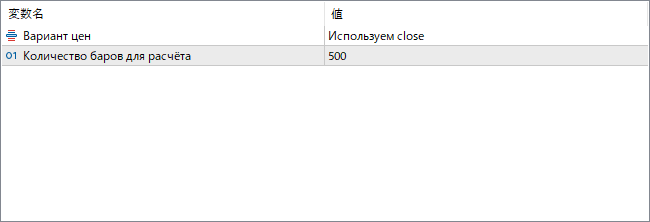
The screenshot above shows the default input parameters in the MT5 settings window.
| Parameter | Description |
|---|---|
| Вариант цен | Specifies which price type is used for calculation, such as close, open, high, or low. The choice determines the data points from which the regression line is built. |
| Количество баров для расчёта | Defines how many bars are used in the linear regression calculation. A higher value smooths the channel and reflects longer-term trends, while a smaller number makes it more responsive to short-term movements. |


