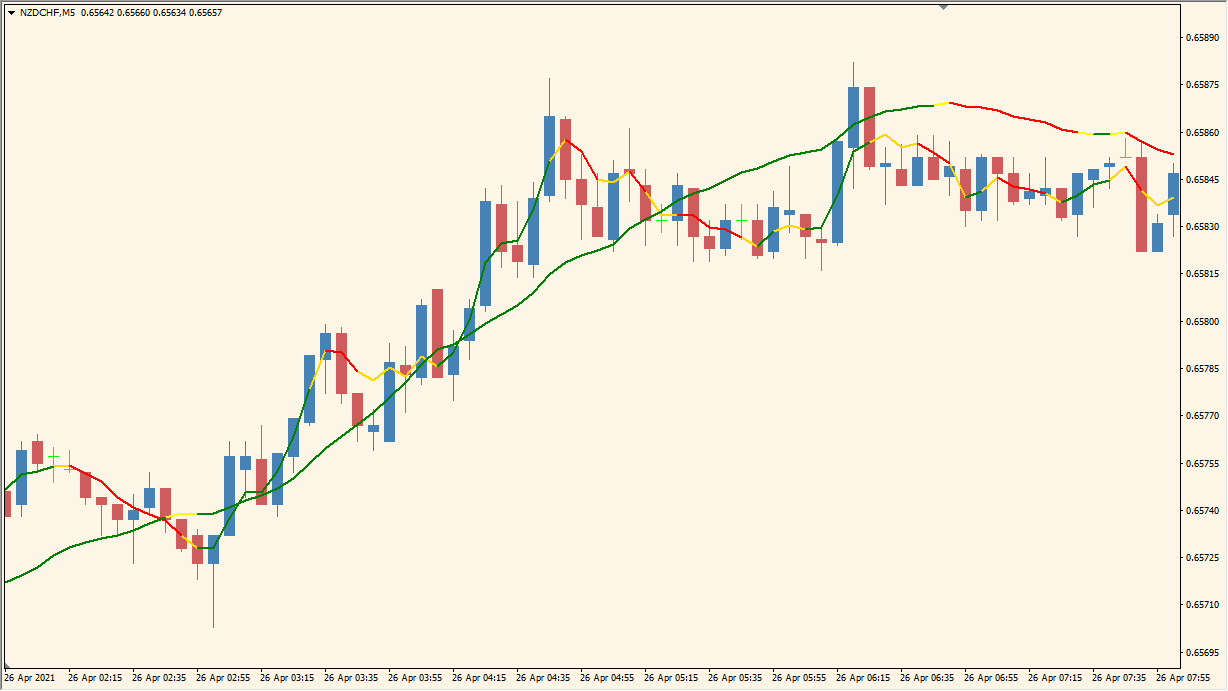
What is LSMA in Color Indicator?
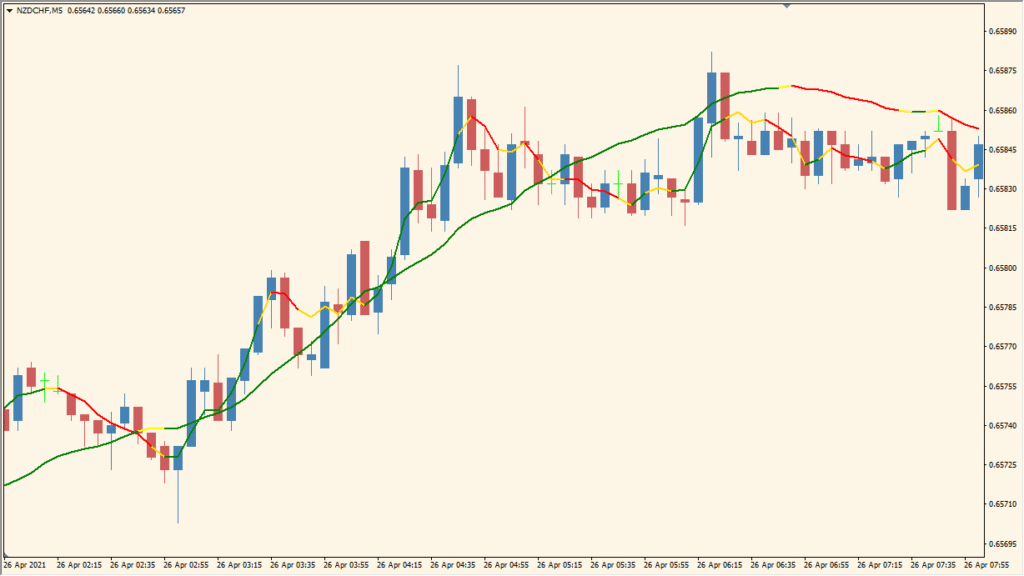
LSMA in Color is an MT4 indicator that plots a Linear Regression Moving Average, also known as a Least Squares Moving Average, with color changes for different directional states. The line remains on the price chart as a compact trend-context reference.
Rperiod controls the calculation length, while Draw4HowLongg controls how many historical bars receive the displayed line. The color change is a visual annotation rather than a standalone trading instruction.
How to Use It in Practice
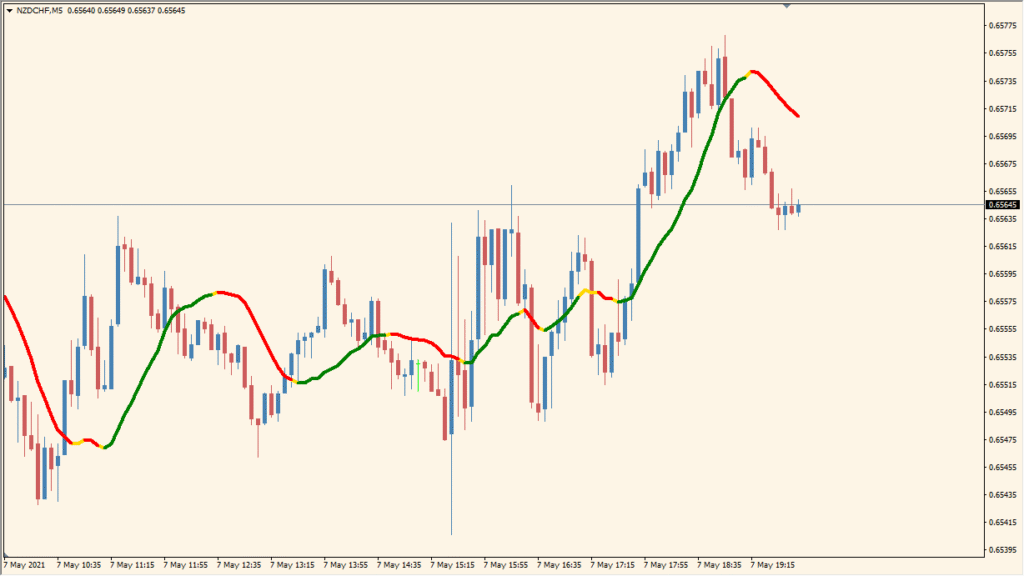
LSMA in Color plots a fast-reacting Least Squares Moving Average in green for upward movement, yellow for neutral movement, and red for downward movement.
- Read the green, yellow, and red sections of the LSMA line as the three colour states.
- Increase Rperiod to make the line respond more slowly; a shorter period makes the already fast LSMA more reactive.
- Set Draw4HowLongg for the number of historical candles on which the line is drawn.
- Rapid response can also create more misleading short-term colour changes, so retain the surrounding candle history in view.
A Linear Regression Moving Average remains easy to locate on the chart, color changes organize directional context, and the two existing Inputs control smoothing and visible history.
MT4 Indicator Parameters
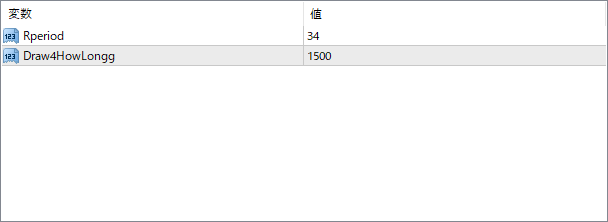
The screenshot above shows the default input parameters in the MT4 settings window.
| Parameter | Description |
|---|---|
| Rperiod | Defines the number of bars used to calculate the LSMA. Higher values make the line smoother and less reactive to short-term price changes. |
| Draw4HowLongg | Sets how many historical bars the LSMA line should be drawn on. Increasing this can give a longer visible trend line on the chart. |


