What is macd-divergence-indicator?
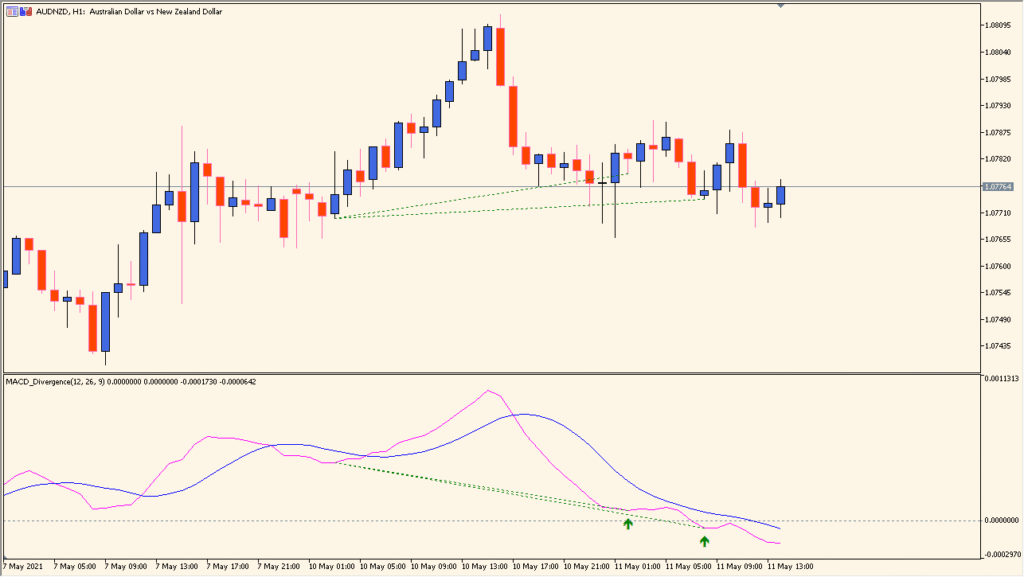
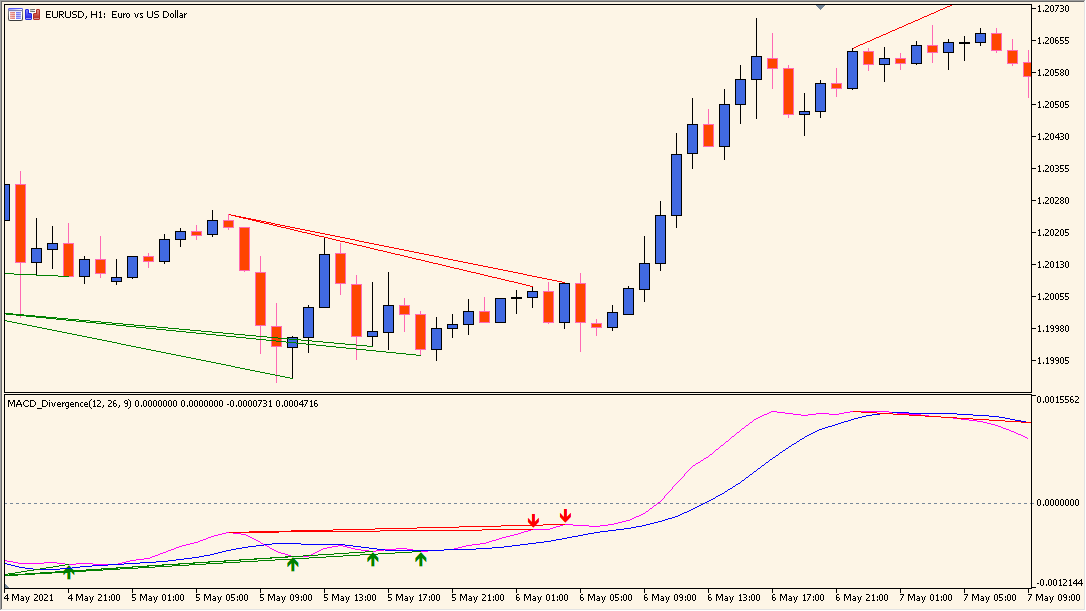
The MACD Divergence Indicator for MT5 compares price movement with the MACD histogram and marks differences between their swing structure. It can draw related trendlines on the price chart and in the MACD window.
Fast EMA, slow EMA, signal SMA, trendline display, and alert settings are available in the Inputs. The result is a compact visual aid for reviewing momentum changes alongside price structure.
How to Use It in Practice
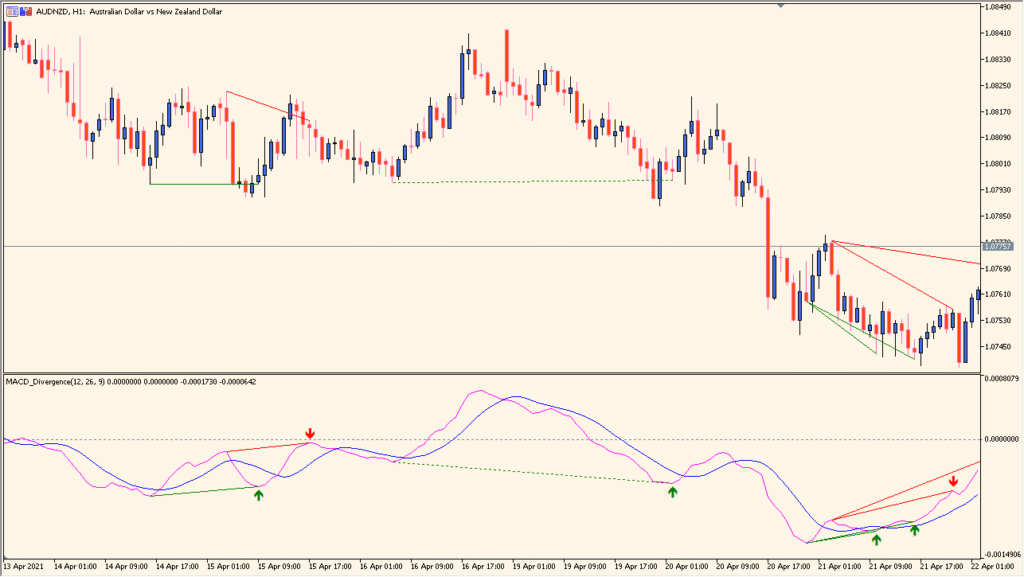
Inspect a marked divergence as a difference between the swing structure of price and the MACD oscillator, then use the paired lines and arrows to locate the exact bars being compared.
- Compare the high or low selected on price with the corresponding high or low selected in the MACD pane.
- Review the arrow and both connecting lines to see which swing pair has been marked.
- Increase the EMA values when the default display produces more arrows than are useful for your chart review.
- Adjust the fast EMA, slow EMA, signal SMA, trendline-display, and alert options without treating a marker as a direction instruction.
Price and MACD trendlines can be viewed together, the MACD periods are configurable, and optional alerts reduce the need to watch every bar continuously.
MT5 Indicator Parameters
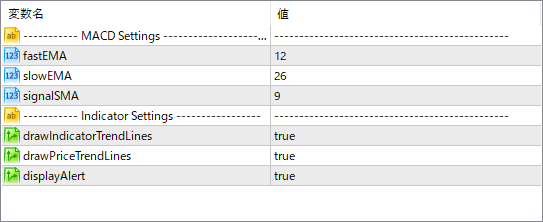
The screenshot above shows the default input parameters in the MT5 settings window.
| Parameter | Description |
|---|---|
| fastEMA | Sets the period for the fast Exponential Moving Average used in the MACD calculation. This controls how sensitive the MACD is to recent price changes. |
| slowEMA | Defines the period for the slow EMA in the MACD calculation. A longer period smooths out the indicator. |
| signalSMA | Specifies the period of the Signal line, which is a simple moving average applied to the MACD line to generate crossover signals. |
| drawIndicatorTrendLines | If set to true, the indicator will automatically draw trendlines on the MACD histogram where divergence is detected. |
| drawPriceTrendLines | If true, the indicator will draw trendlines on the price chart to visually represent divergence points. |
| displayAlert | When enabled, the indicator will show pop-up alerts when a divergence pattern is identified, helping you act promptly. |


