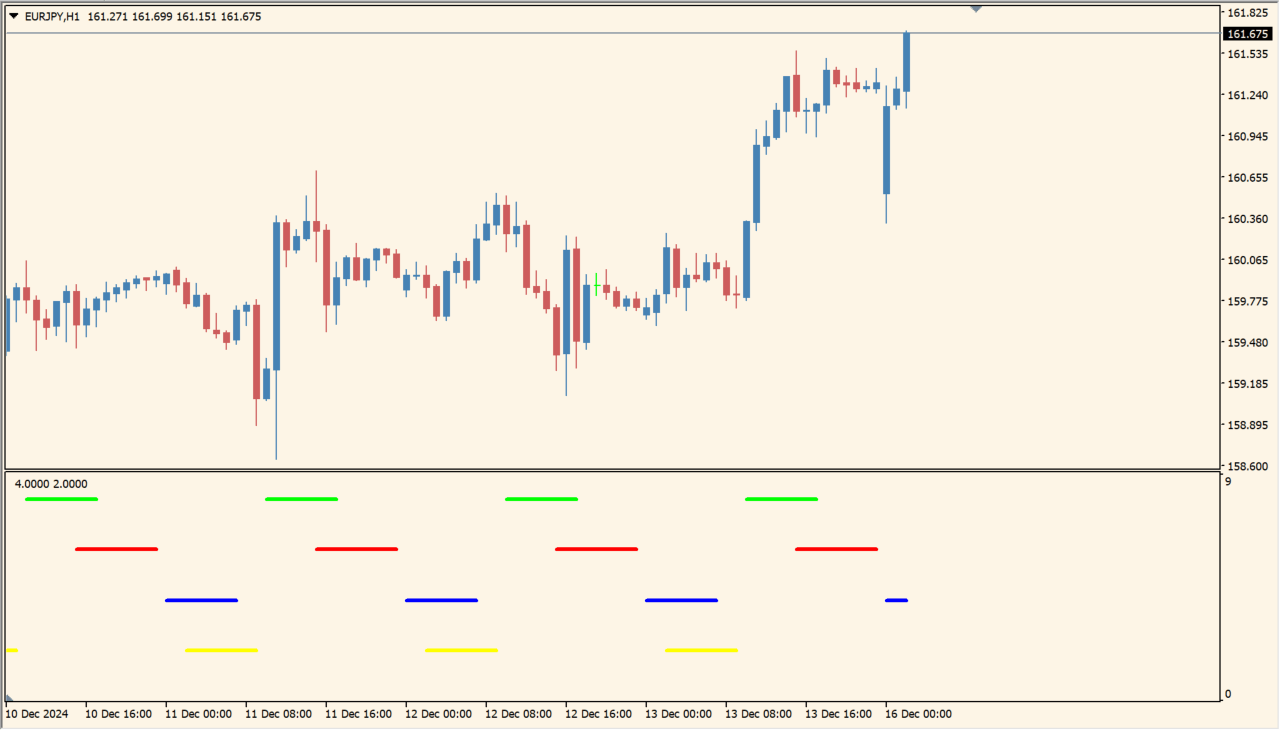
What is Market Hours?
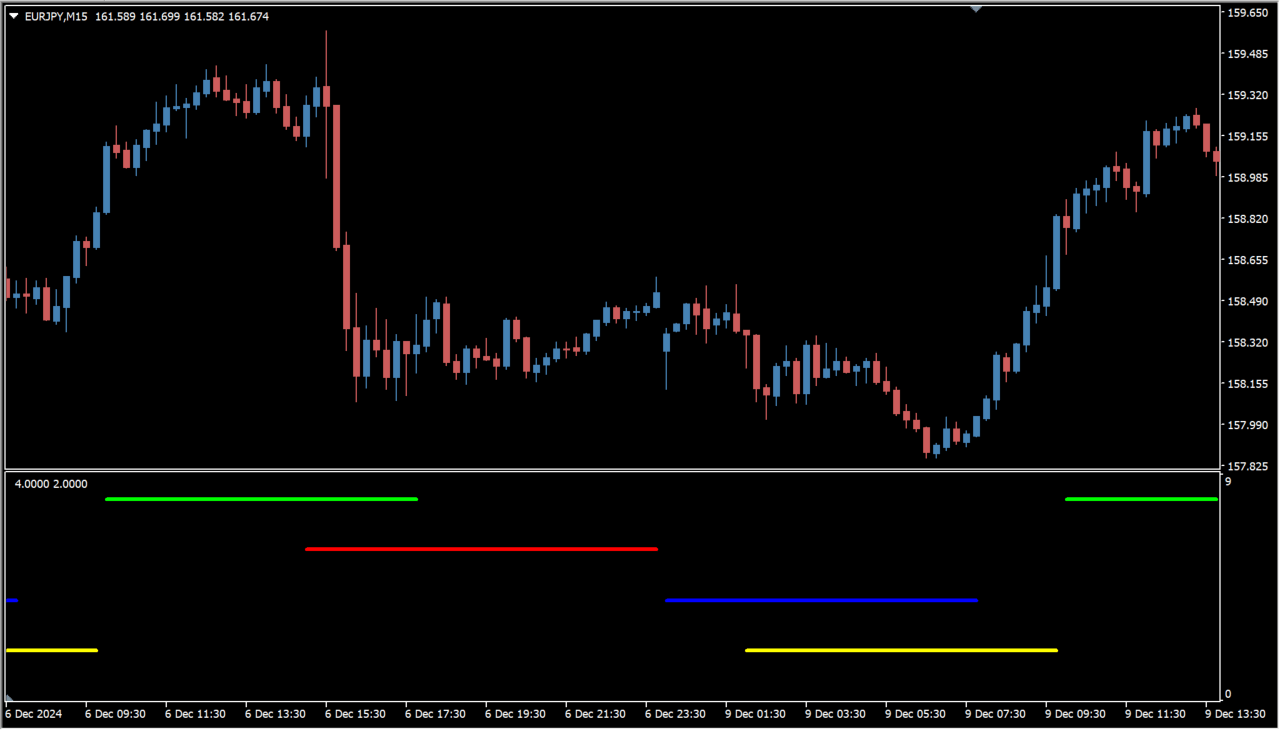
Market Hours separates the London, New York, Sydney, and Tokyo sessions on a chart. The source colors are green for London, red for New York, blue for Sydney, and yellow for Tokyo.
Each session start and end can be changed from the Inputs dialog, making the display useful when broker time or a preferred session definition differs from the defaults.
How to use Market Hours
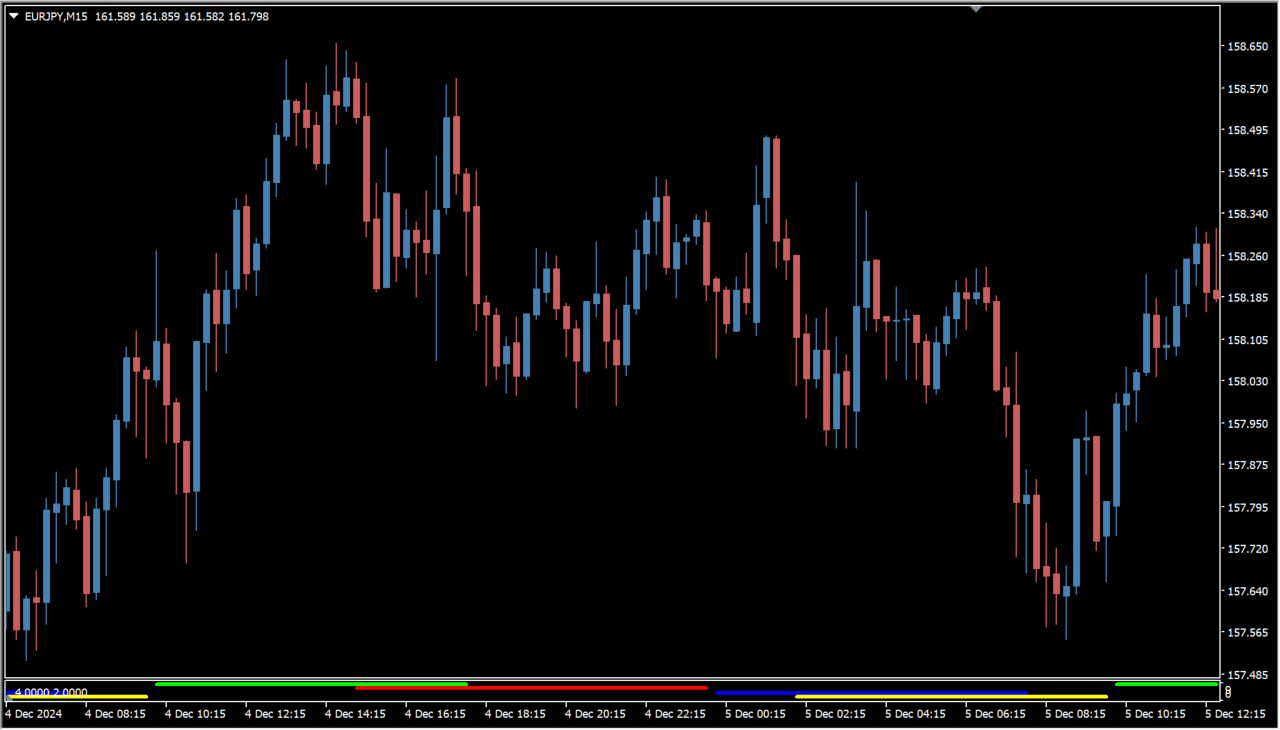
Apply Market Hours to an MT4 chart and use the colored lines to identify which session boundary is near the current candles.
Set the start and end time inputs for each session to match the broker clock, then keep the chart scale compact enough to see the session sequence.
Where it helps
Separates the London, New York, Sydney, and Tokyo time blocks in one view.
Makes the session boundaries easy to distinguish without extra labels.
Supports custom start and end times for different broker schedules.
MT4 Indicator Parameters
The table below lists the available MT4 indicator parameters. You can customize these options in the MetaTrader Inputs dialog to match your trading preferences.
| Parameter | Description |
|---|---|
| LondonOpen | Controls this indicator option. Default: 10. |
| LondonClose | Controls this indicator option. Default: 18. |
| NewYorkOpen | Controls this indicator option. Default: 15. |
| NewYorkClose | Controls this indicator option. Default: 0. |
| SydneyOpen | Controls this indicator option. Default: 0. |
| SydneyClose | Controls this indicator option. Default: 8. |
| TokyoOpen | Controls this indicator option. Default: 2. |
| TokyoClose | Controls this indicator option. Default: 10. |
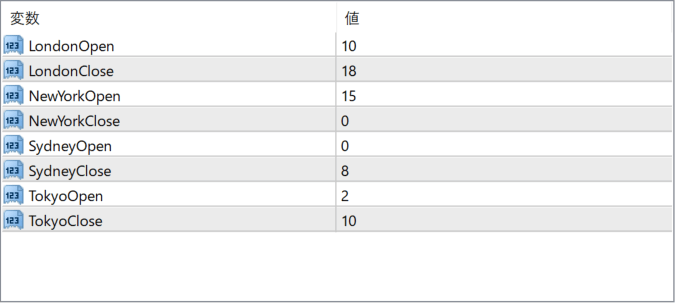
The screenshot above shows the default input parameters in the MT4 settings window.
How to Install .ex4 Indicator in MetaTrader 4
- Download the ZIP file and extract it.
- In MT4, select File → Open Data Folder.
- Open MQL4 → Indicators and copy the EX4 or MQ4 file into it.
- If the package includes library files, copy them to MQL4 → Libraries. Copy TPL files to the top-level templates folder.
- Restart MT4, find the indicator in the Navigator, and drag it onto a chart.
Test the tool on a demo account first. File contents and required folders can vary between packages.


