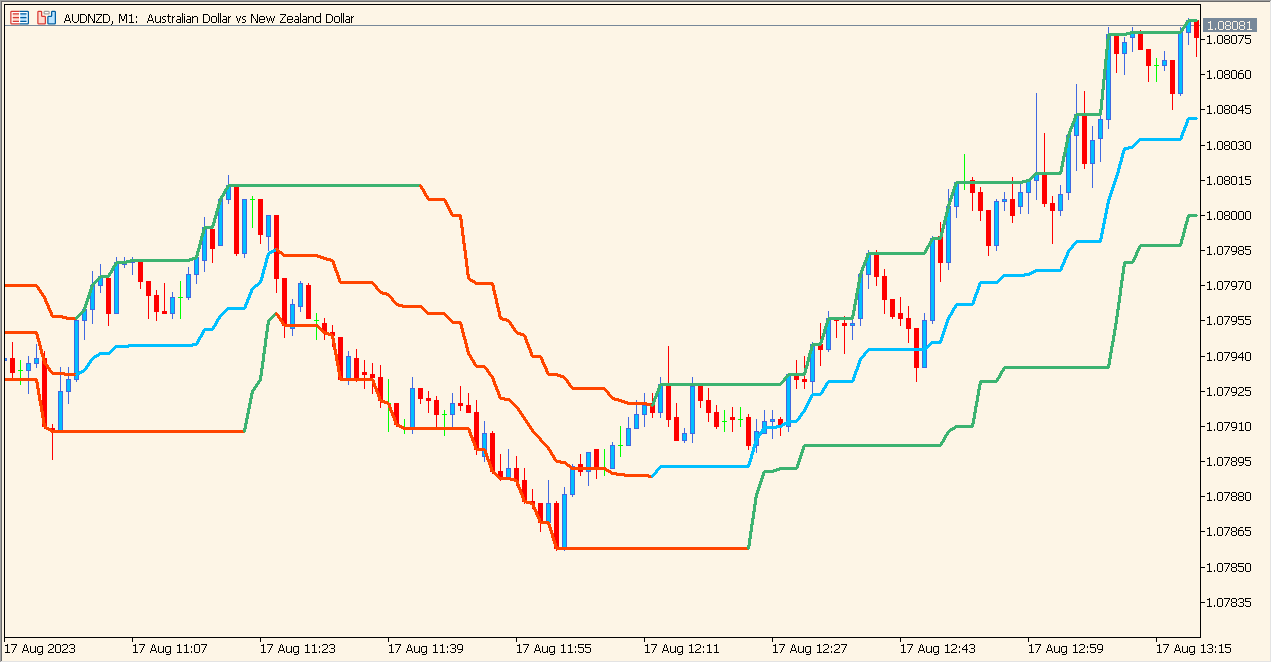
What is MinMax Indicator?
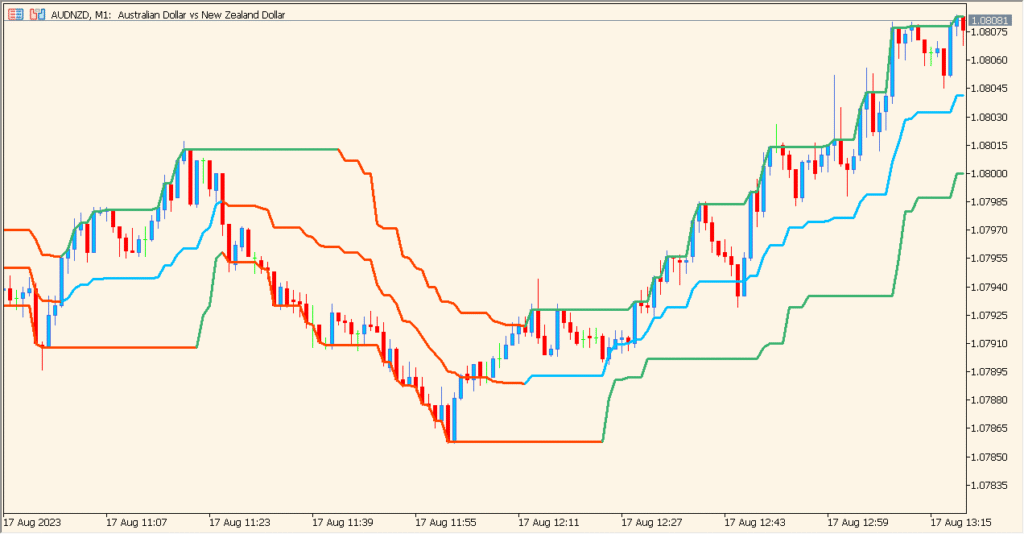
MinMax is an MT5 indicator that plots the highest and lowest price values over a selected lookback period. Price source and MinMax period determine the dynamic upper and lower boundaries shown on the chart.
The lines provide a simple visual record of recent range extremes for comparing current price location. They update with new data without assuming a reaction at either boundary.
How to Use It in Practice
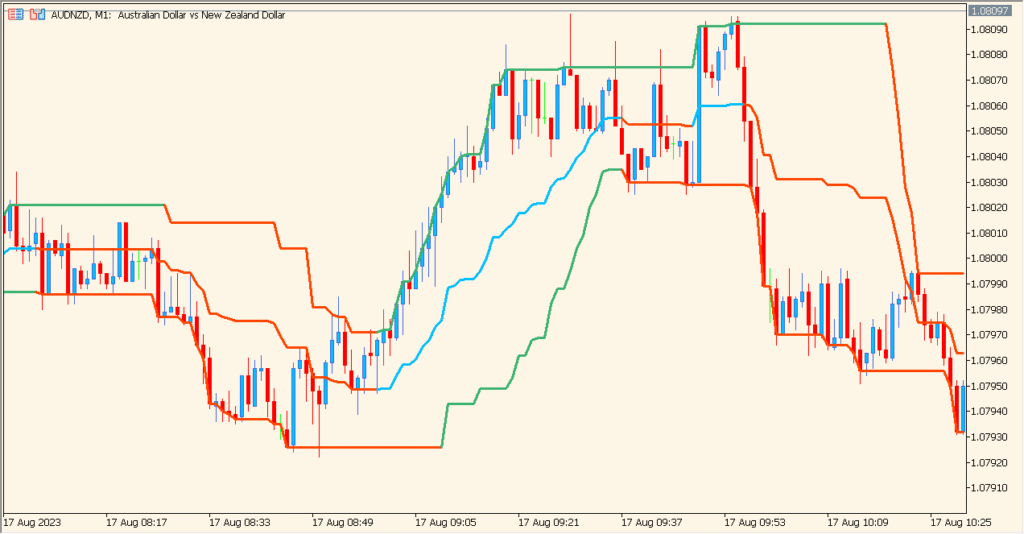
Read the green and red range states with the upper, lower, and central lines, then compare their placement with the selected price source used for the high-low calculation.
- Compare price with the upper and lower boundaries first, then note the center line as a separate reference inside the range.
- Use Price to choose the calculation location, including Close or Median, the midpoint of each bar’s high and low.
- Adjust MinMax period to change the high-low sample used for the displayed boundaries.
- Keep the color state and the current range location alongside broader chart structure rather than treating a boundary contact as sufficient on its own.
Recent extremes remain visible as two clean lines, and period or price-source settings support different chart horizons.
MT5 Indicator Parameters
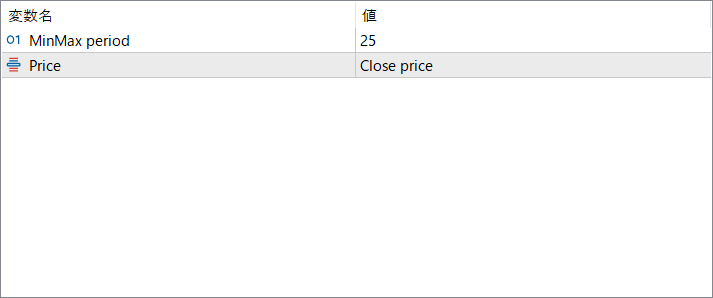
The screenshot above shows the default input parameters in the MT5 settings window.
| Parameter | Description |
|---|---|
| MinMax period | Defines how many past bars are checked to calculate the highest high and lowest low. A larger period smooths the bands and reduces noise, while a shorter period makes the indicator more reactive. |
| Price | Selects which price source (such as Close, High, Low, etc.) is used when determining the high/low range. Choosing different sources slightly changes how the boundaries are formed. |


