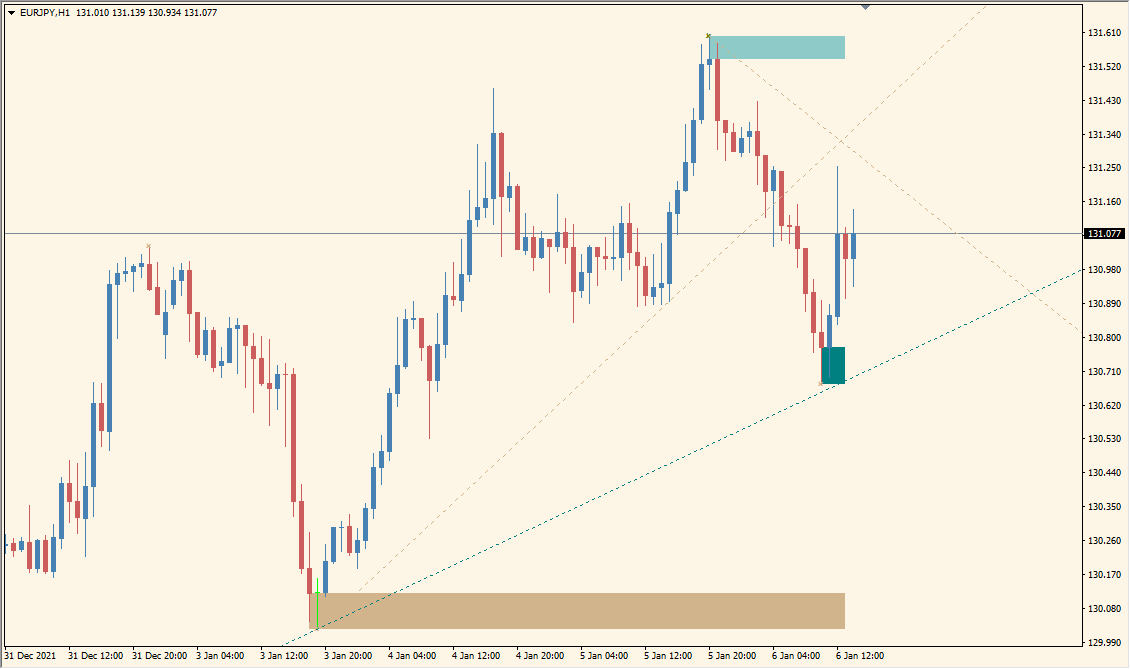
What is MZZ9_trendLine_SR Indicator?
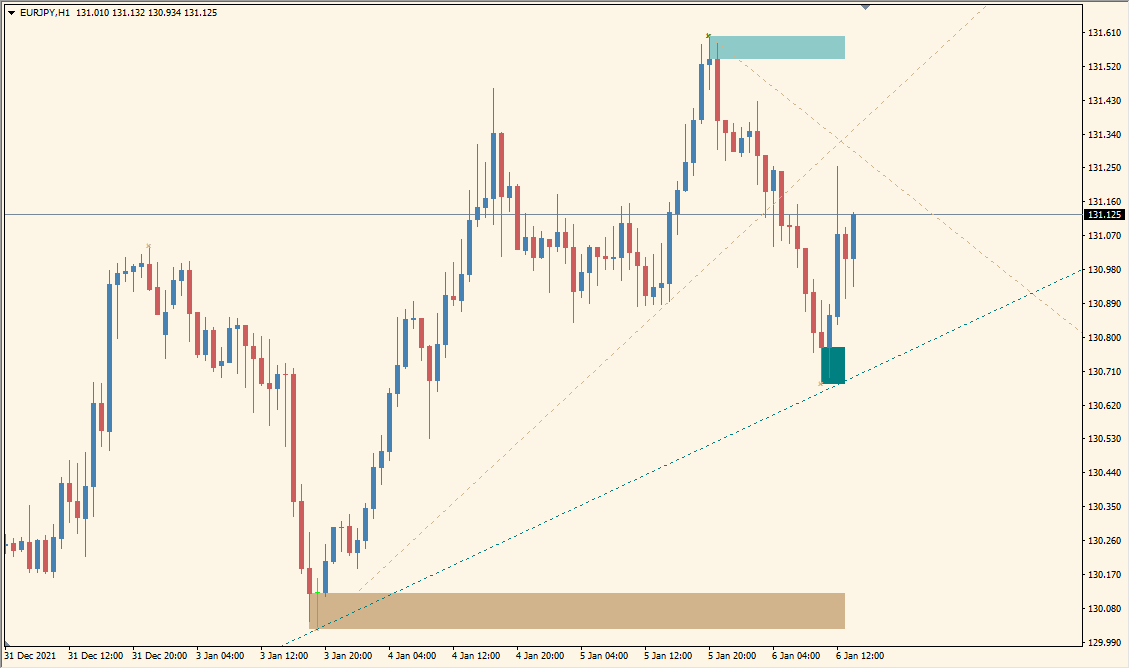
MZZ9 Trendline SR for MT4 uses ZigZag-style swing structure to draw trendlines and identify support and resistance zones. Multiple depth settings can show different layers of historical price structure.
ED, ExtDepth, ExtBackstep, bar-range, Fibonacci, color, and line settings control the amount and appearance of the display. The indicator provides an organized chart reference for reviewing swings and level relationships.
How to Use It in Practice
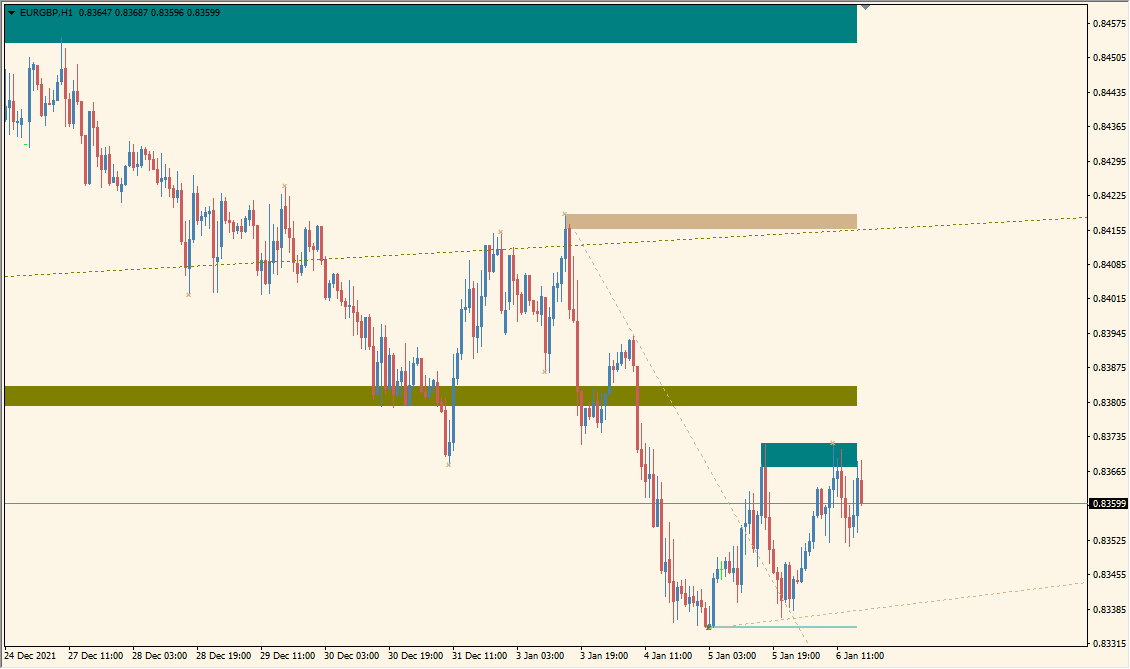
Read the support and resistance zones as ZigZag-derived swing areas shown across several timeframes; the colors identify displayed groups but do not rank one zone above another.
- Review the swing peaks and troughs behind the zones, then compare the automatically drawn trendlines with the same structure.
- Read the nine comma-separated Gross Period values in their documented order from 1-minute through higher timeframes.
- Adjust the matching comma-separated ExDepth or ExDeviation value for only the timeframe position you intend to change.
- Use ExBackstep to set the minimum bar distance before the next opposite ZigZag swing is recognized.
- Keep Fibonacci, color, and line settings as display aids while comparing the plotted structure with recent price movement.
Trendlines, support/resistance zones, and optional Fibonacci references share one display, while depth and styling inputs provide control over chart detail.
MT4 Indicator Parameters
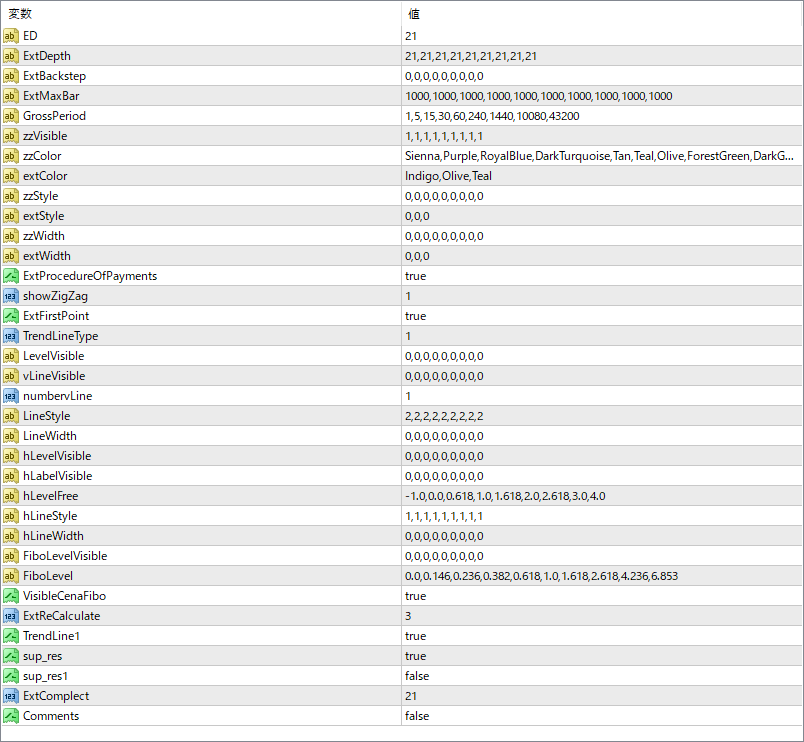
The screenshot above shows the default input parameters in the MT4 settings window.
| Parameter | Description |
|---|---|
| ED | Specifies the ZigZag depth setting used to detect major swing highs and lows for trendline plotting. |
| ExtDepth | A list of ZigZag depth values used in multi-layer calculations. Each entry affects the level of detail drawn. |
| ExtBackstep | Sets the number of bars to ignore before confirming a swing point. |
| abtMaxBar | Controls how far back the indicator searches for structural points on the chart. |
| GrossPeriod | Timeframe parameters for calculating multi-timeframe trendlines or levels. |
| zzVisible | Defines which ZigZag levels are shown on the chart. Each 1 or 0 enables or disables a layer. |
| zzColor | Color configuration for the ZigZag lines by depth layer. |
| extColor | Color for the extended trendlines. |
| zzStyle | Line style settings for the ZigZag lines. |
| extStyle | Style setting for the extended trendlines. |
| zzWidth | Line thickness for the ZigZag lines. |
| extWidth | Line thickness for the extended trendlines. |
| ExtProcedureOfPayments | Internal flag for processing additional drawing logic. Typically left enabled. |
| showZigZag | If true, ZigZag structure lines are drawn. |
| ExtFirstPoint | When true, trendline drawing starts from the very first valid point found. |
| TrendLineType | Defines how trendlines are drawn — by angle, slope, or fixed logic (based on coded setting). |
| LevelVisible | Controls visibility of the support/resistance zones by level. |
| VLineVisible | If true, vertical reference lines will appear. |
| numberLine | Specifies how many trendlines to draw per ZigZag structure. |
| LineStyle | Style of each individual trendline (dotted, dashed, etc.). |
| LineWidth | Thickness of the trendlines. |
| hLevelVisible | Controls which horizontal support/resistance zones are visible. |
| hLabelVisible | If true, text labels will be shown for the S/R zones. |
| hLevelFree | Custom Fibonacci ratio levels for zone drawing. Allows personalized level settings. |
| hLineStyle | Style of horizontal support/resistance lines. |
| hLineWidth | Thickness of the horizontal lines. |
| FilterLevelVisible | Logic filter to decide if a level should be drawn or not. Helps reduce clutter. |


