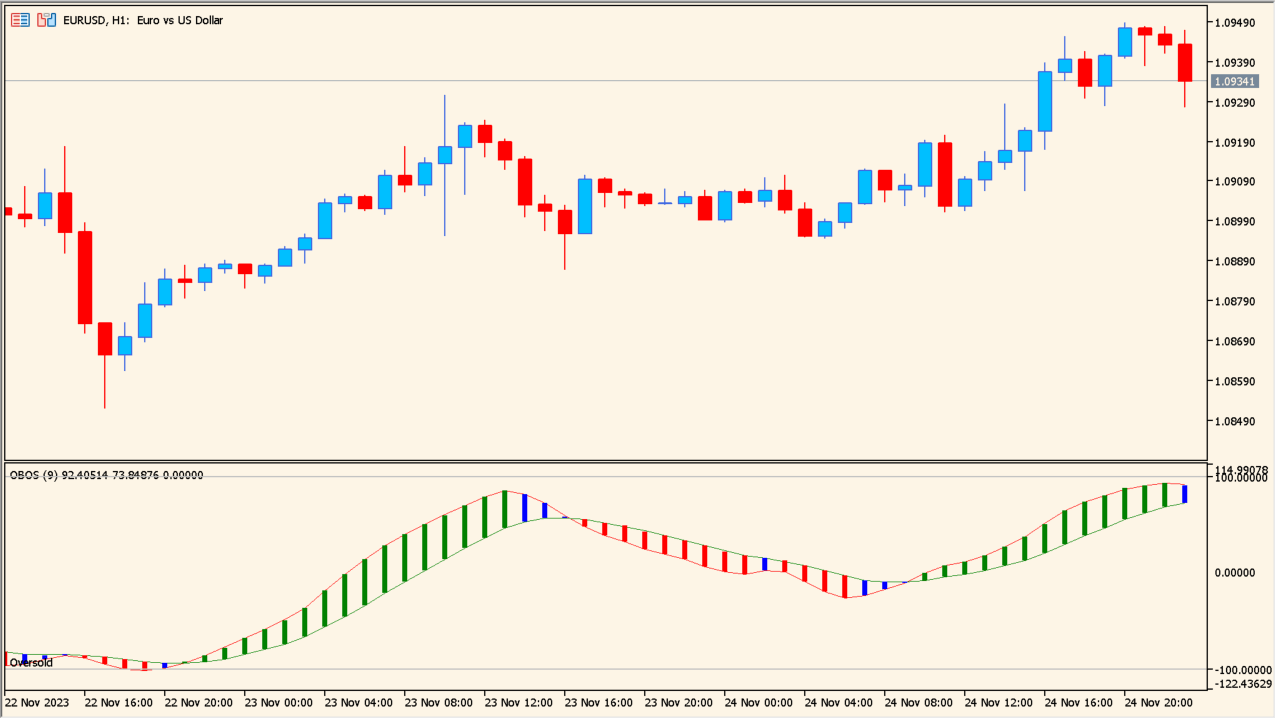
What is OBOS 1.00 Indicator?
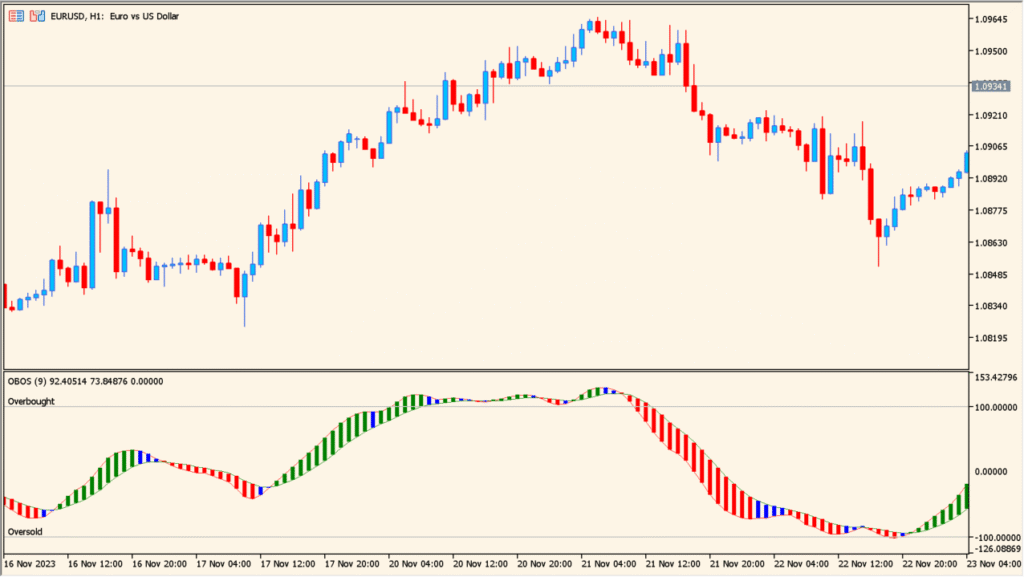
OBOS 1.00 is an MT5 oscillator that displays a smooth line or histogram around configurable upper and lower reference levels. Period, colors, and level settings control the visible momentum view.
The display helps organize stretched and neutral areas for chart review. An extreme reading is visual context, not a conclusion that price will turn or continue.
How to Use It in Practice
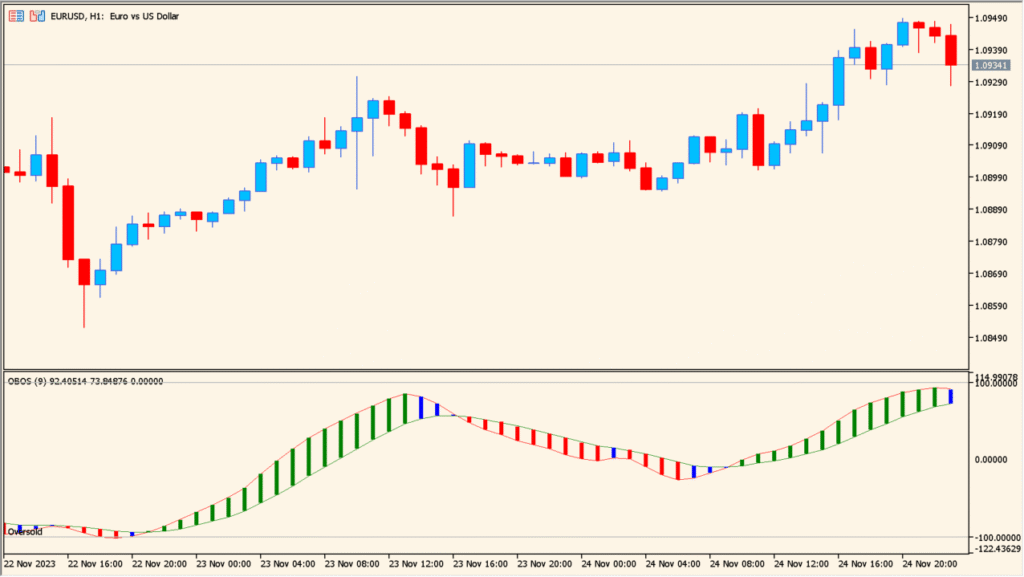
Read OBOS 1.00 through its two exponential-average components, color state, and upper or lower level lines, with particular attention to the price-versus-oscillator swing pairs that form visible divergence or hidden-divergence patterns.
- Compare green, red, and blue states with price first; ordinary periods can move closely with candles and show little separation.
- Mark matching highs or lows on price and the oscillator when reviewing a visible divergence or hidden-divergence shape.
- Use Period to change the calculation sample and Overbought or Oversold to move the two level lines.
- Keep the divergence comparison with the surrounding chart rather than relying on a color change alone.
A smooth oscillator keeps upper and lower context visible, configurable levels organize the pane, and color changes aid comparison.
MT5 Indicator Parameters
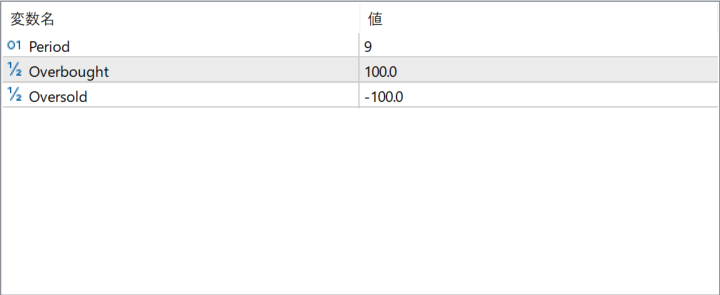
The screenshot above shows the default input parameters in the MT5 settings window.
| Parameter | Description |
|---|---|
| Period | Defines the calculation length of the oscillator. A shorter period makes the indicator more responsive, while a longer period smooths out noise. |
| Overbought | Sets the upper boundary of the indicator. Values above this level suggest the market may be stretched and potentially due for a slowdown or reversal. |
| Oversold | Sets the lower boundary. When the oscillator falls below this level, it indicates oversold conditions where buying pressure may soon return. |


