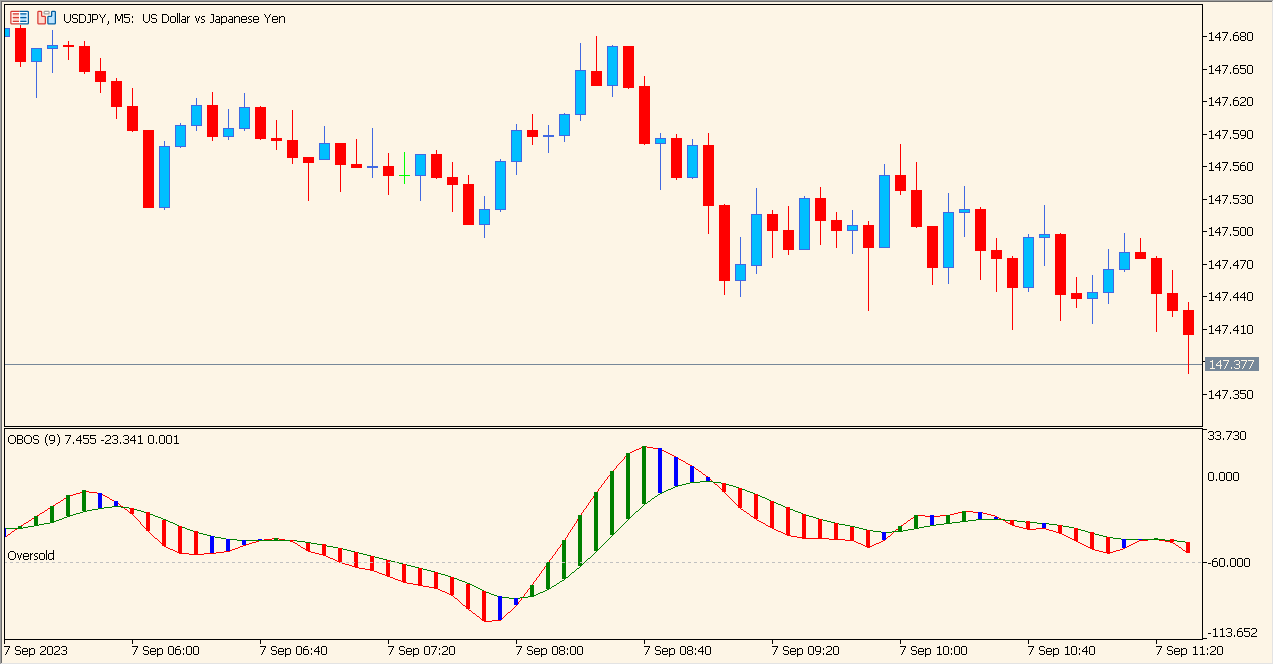
What is OBOS Indicator?
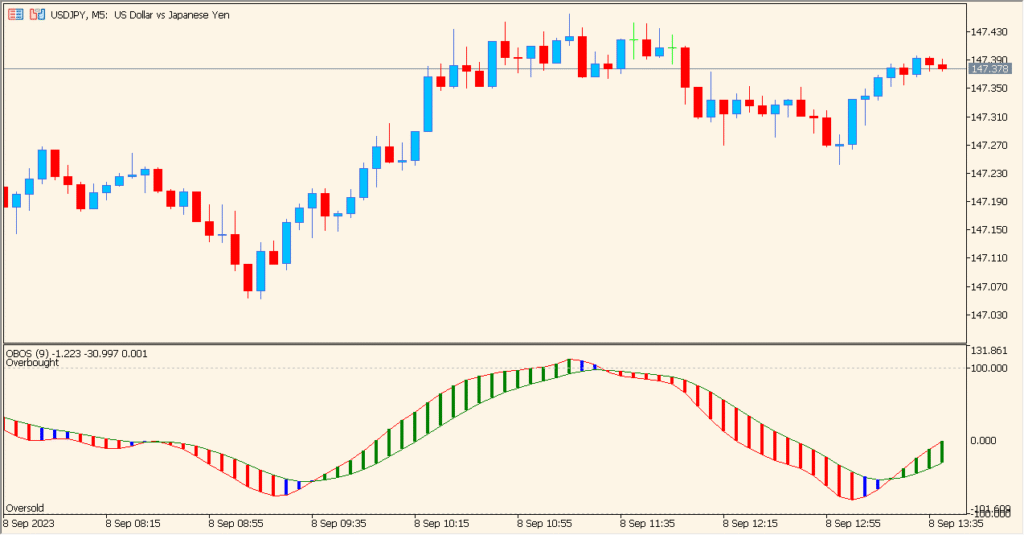
OBOS is an MT5 indicator that displays a smooth wave-style histogram with configurable upper and lower reference thresholds. Histogram colors distinguish the displayed direction of the wave, while the Period setting controls the calculation window.
The wave and threshold lines help organize oscillator context when reviewing price behavior. A reading near an upper or lower reference is a visual condition, not a conclusion about what follows.
How to Use It in Practice
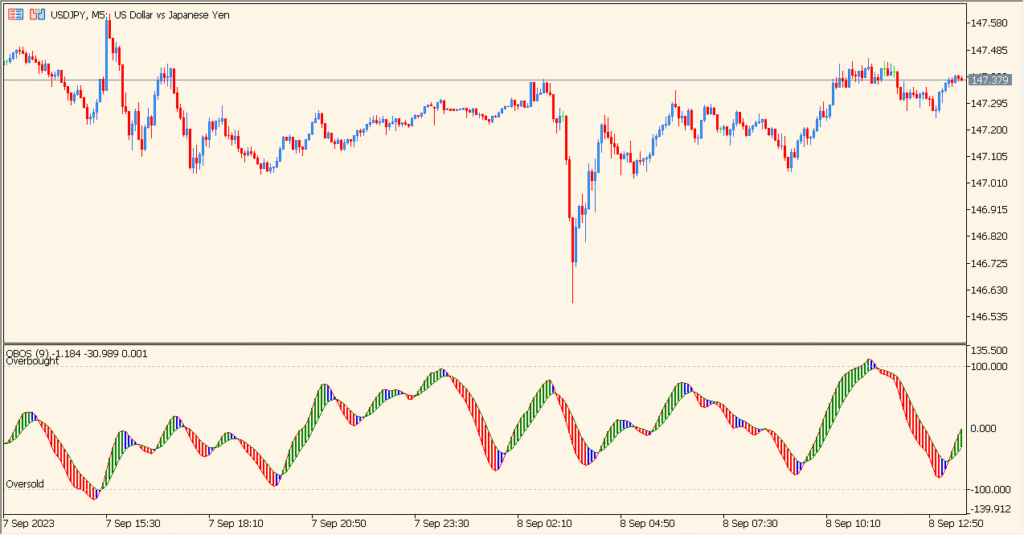
Read the OBOS color state with its two dotted threshold lines: red marks a falling state, green a rising state, and blue a short range-like state.
- Compare the histogram color with the slope of the wave and the price chart rather than treating a short blue state as a full range classification.
- Use the two dotted lines as the configured Overbought and Oversold references.
- Increase Period from the short default sample when comparing a longer wave behavior.
- Review abrupt price movement separately; the displayed calculation is intended to remain organized even when movement is sudden.
The wave and histogram are visible in one oscillator pane, configurable thresholds provide visual structure, and period or color behavior can be adjusted for chart readability.
MT5 Indicator Parameters
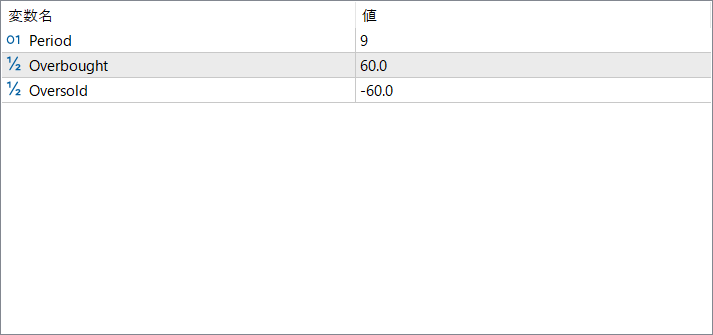
The screenshot above shows the default input parameters in the MT5 settings window.
| Parameter | Description |
|---|---|
| Period | Sets the number of bars used to calculate the indicator’s wave. Longer periods smooth the wave, while shorter ones make it more reactive. |
| Overbought | Defines the upper threshold at which the market is considered overbought. When the wave approaches or exceeds this level, momentum may be stretched to the upside. |
| Oversold | Defines the lower threshold marking oversold conditions. Reaching this zone may signal weakened bearish momentum or a possible upward reversal. |


